Historical Weather Reconstruction for Claims Disputes
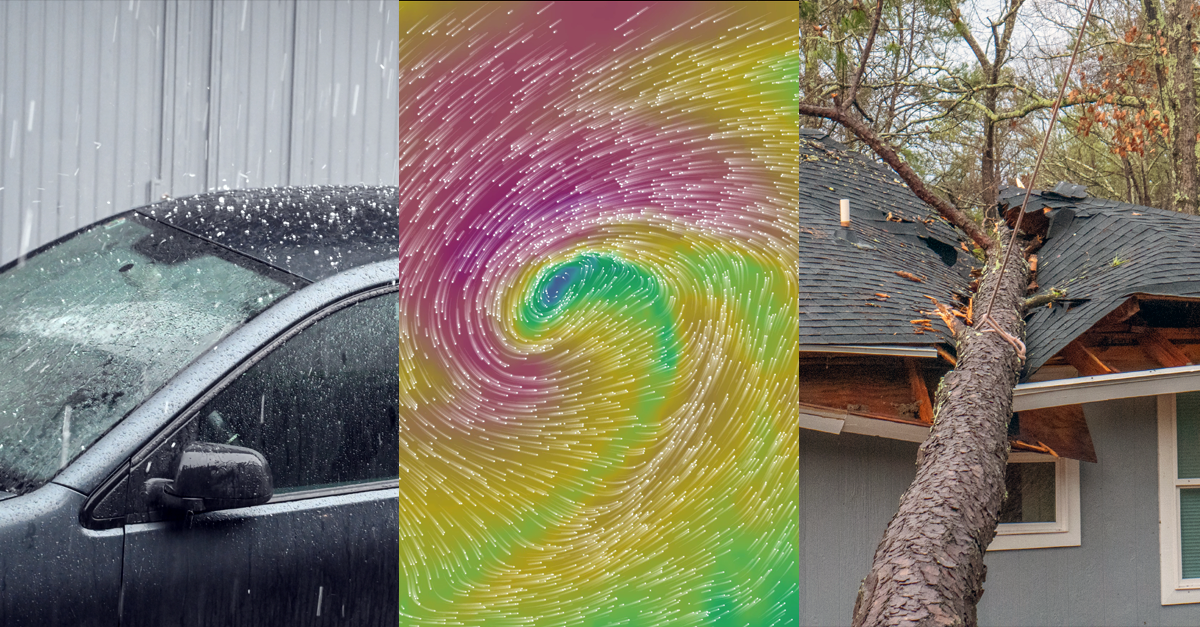
When weather becomes part of an insurance claim, the central question is clear: what conditions were present at the reported location and during the reported time window?
A regional warning or a news report that mentions a storm is usually too broad. Claims handlers may need to establish when the event arrived, how long it lasted, which weather variable was relevant, and whether its intensity was consistent with the reported damage. A wind claim may depend on peak gusts and wind direction, while a water-ingress claim may require hourly precipitation totals and information about earlier rainfall.
Weather data can support this assessment, but it is important to separate two questions. The first is whether a relevant weather event occurred. The second is whether that event caused the specific damage. Weather records can help answer the first question; determining causation may still require an inspection of the asset, its condition and the applicable policy terms.
Reconstructing weather where no station exists
Direct measurements provide the clearest record of conditions at a sensor, but weather stations do not cover every location. Their observations can also contain gaps, and each station represents its own surroundings, elevation, installation height and exposure. A station several kilometres away may have experienced different wind, precipitation or temperature conditions.
Reanalysis and weather-simulation datasets help fill these spatial and temporal gaps. A reanalysis combines numerical weather models with observations through data assimilation, creating a physically consistent estimate of past atmospheric conditions across a continuous grid. The result is a complete reconstruction rather than a collection of isolated station readings. It should still be understood as a model-based estimate, not as a direct measurement at the insured property.
Different data sources can contribute different information:
- Weather stations record conditions at specific sensors.
- Radar shows the spatial structure and movement of precipitation where coverage is available.
- Satellite data adds information about cloud systems and storm development.
- Reanalysis and simulation data provide continuous estimates across areas and periods where observations may be sparse or missing.
A robust reconstruction may use several of these sources together, particularly when the claim concerns a localised or short-lived event.
What meteoblue history+ provides
meteoblue history+ gives users direct access to a global archive of historical weather simulations. It provides hourly, gap-free time series for any selected coordinate worldwide, extending back to 1940. Available variables include temperature, relative humidity, precipitation, snowfall, pressure, cloud cover, solar radiation, wind speed, wind direction and wind gusts, including wind information at several atmospheric levels.
The service offers several advantages for claims analysis:
Continuous hourly data: Each hour in the selected period contains a value. This avoids the gaps that often appear in station records and makes it easier to reconstruct the sequence of an event.
Worldwide coverage: Data can be retrieved for a requested coordinate without depending on the presence of a nearby weather station.
Multiple datasets: The interface includes the ERA5 reanalysis, meteoblue NEMS model data and higher-resolution model datasets for many regions. Dataset availability and suitability depend on the location, period and purpose of the analysis.
Interactive analysis: Users can examine time series online and compare locations or periods without first building a separate analysis environment.
Data downloads: Historical series can be downloaded as CSV files for further processing, documentation or integration into established claims workflows. Access for activated locations remains available for one year and includes unlimited downloads and regular dataset updates.
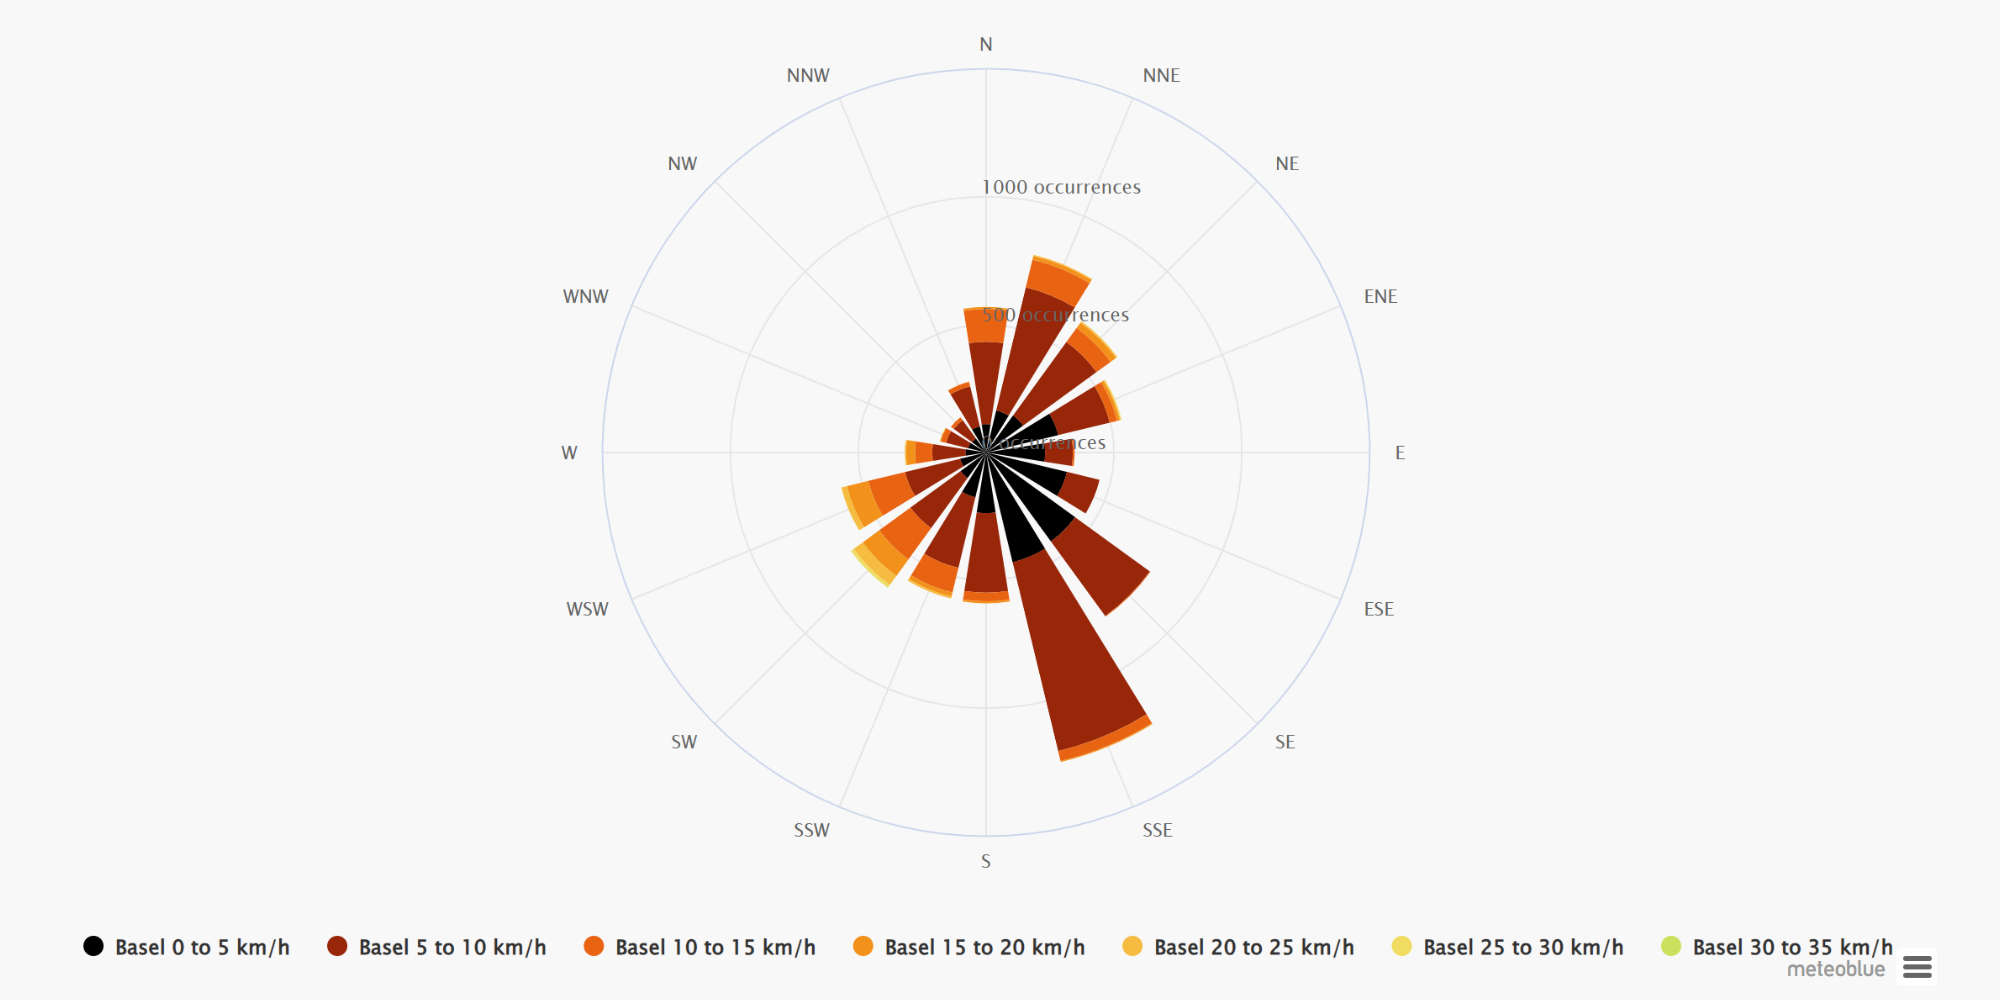
history+ also includes analytical tools such as year comparison, histograms, wind roses and weather-risk assessments. A histogram can show how unusual a temperature or precipitation value was in the historical record. A wind rose provides the distribution of wind speed and direction, while the risk-assessment interface can evaluate how often a user-defined threshold was exceeded.

These tools add useful context to an individual claim. A claims professional can assess the reported event itself and then check whether similar conditions occur regularly at that location or represent an unusual episode.
Practical applications in claims assessment
Wind and storm damage: For roof, scaffolding or vegetation claims, the analysis may include average wind speed, maximum gusts, wind direction and the duration of these weather conditions.
Wind direction can be relevant because asset exposure varies by orientation and surrounding structures. A building may be sheltered from one direction and exposed from another. However, modelled wind at a standard height does not reproduce the exact flow around an individual roof, tree or building. Local obstacles and terrain must therefore be considered during interpretation.
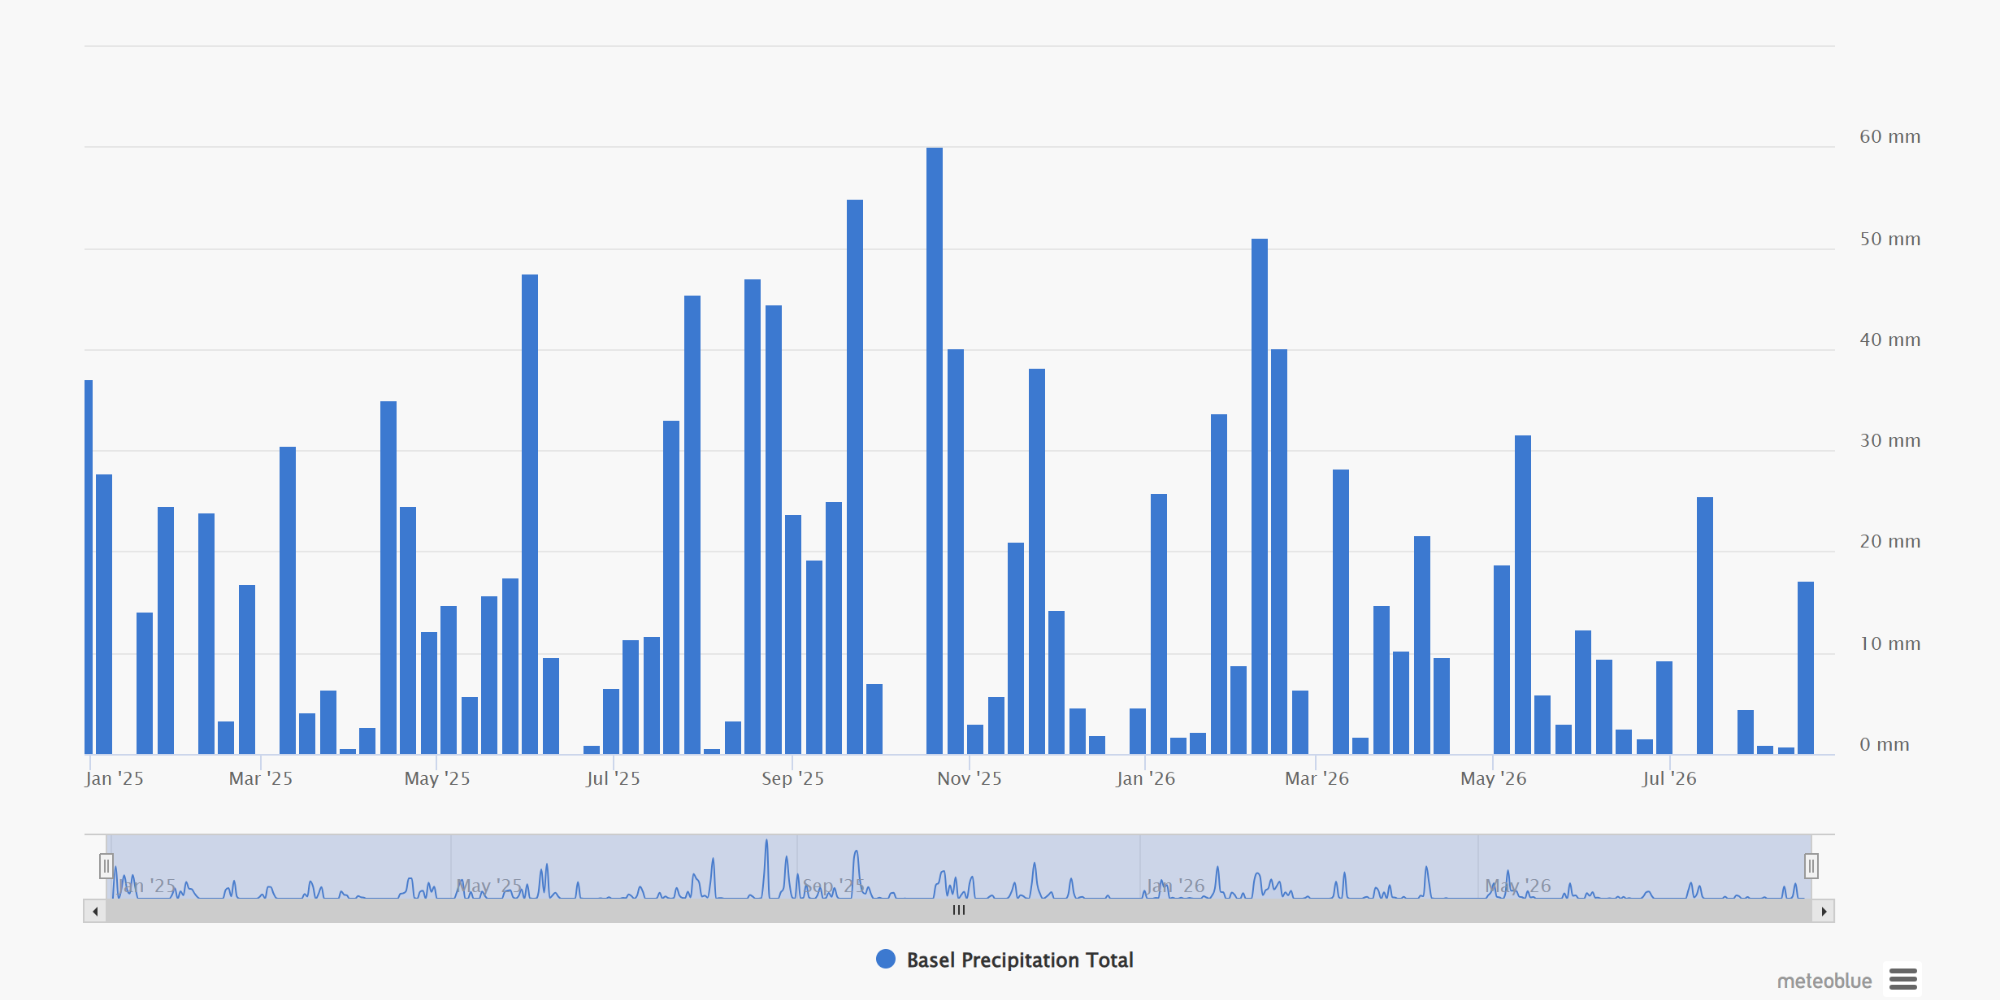
Heavy rainfall and water ingress: Hourly precipitation data can show when rainfall began, how intense it became and whether the event consisted of one short peak or several hours of persistent rain. Reviewing the period before the reported damage can also reveal whether the ground and drainage systems were already exposed to repeated rainfall.
Precipitation data alone cannot prove that flooding occurred inside a particular building. Drainage capacity, terrain, soil conditions, construction details and water pathways also influence the result. The data can nevertheless establish whether rainfall conditions were consistent with the timing and type of reported damage.
Snow, frost and temperature-related claims: Temperature, snowfall and precipitation-phase information can support assessments involving frozen pipes, frost damage, snow loading or freeze–thaw cycles.
The timing is important. A short drop below freezing may have a different effect from several consecutive cold nights, while rapid warming after snowfall may introduce meltwater-related risks. Hourly data allows claims teams to examine these sequences rather than relying only on daily minimum and maximum temperatures.
Hail and local thunderstorms: Hail is highly localised and can affect one neighbourhood while leaving nearby areas untouched. A gridded historical simulation may indicate that the wider environment supported thunderstorms, but it may not resolve the exact hail swath.
Hail claims generally require additional sources, such as radar archives, lightning data, verified observations, damage surveys or reports from meteorological authorities. The same caution applies to isolated tornadoes and very local wind gusts.
Portfolio-wide claims screening
For insurers handling many claims after a storm, consistent gridded data can support initial triage. Claim locations can be compared with the event footprint, time window and relevant thresholds to identify:
- claims that align closely with the reconstructed event;
- locations outside the main affected area;
- claims requiring additional station or radar analysis;
- unusual timing or intensity patterns that need closer review.
For repeated or large-scale analyses, the meteoblue History API provides programmatic access to historical data in formats such as CSV and JSON. This allows insurers and analytics teams to incorporate weather information into automated claims platforms, exposure models or internal dashboards rather than retrieving each location manually. The History API provides data beginning in 1940 and supports hourly as well as aggregated historical values.
A structured workflow for a weather-related claim
A useful reconstruction begins with a clearly defined question. “Was there bad weather?” is too broad. A better request may be: Did wind gusts exceed the policy threshold at or near the property between 18:00 and 23:00 local time?
The following information should be established before extracting data:
- Exact coordinate and elevation of the reported property or asset
- Reported date and time window, including the correct time zone
- Relevant weather variable, such as wind gust, precipitationor temperature
- Required height or accumulation period, where applicable
- Policy threshold or claim criterion that needs to be assessed
- Dataset and model version used for the reconstruction
- Extraction date, units and aggregation method used in the analysis
The analysis should examine the full event window rather than a single value. For example, a wind claim may need the progression of wind speed and direction before, during and after the reported damage. A precipitation claim may require hourly totals, cumulative rainfall and conditions during previous days.
Results can then be compared with available observations. meteoblue Measurements API provides access to real-time and historical readings from a global weather-station network, including station metadata and quality-controlled data. Station measurements can provide an additional independent reference where suitable coverage exists.
Understanding the limits
The completeness of a dataset should not be confused with certainty.
history+ provides historical simulation data, not measurements taken at the property. Its spatial resolution ranges approximately from 4 to 30 kilometres, depending on the location and period. Historical data beginning in 1940 are available at coarser resolution, while higher-resolution datasets are available for most locations from 2008 onward. Data before 1980 can carry greater uncertainty because satellite observations were not yet available in the same way as in later decades.
Historical simulation data also has limitations. Local microclimates and very small-scale extremes, such as hail, intense convective rainfall or strong wind gusts, may not be fully represented by the model grid. For insurance or legally sensitive cases, historical model data should therefore be interpreted together with other available evidence and according to local requirements.
history+ is best used as a documented reconstruction and analytical reference. It can establish regional and grid-scale weather context, support initial claim validation and identify cases that need more detailed investigation. It does not replace damage inspection, policy interpretation or certified observations where these are required.
A consistent basis for claims decisions
Historical weather reconstruction gives claims professionals a structured way to examine past conditions even when a station is not located at the insured site. Gap-free hourly data supports faster screening, consistent comparisons and clearer documentation across individual claims or larger portfolios.
Its strongest value lies in the combination of worldwide availability, long historical coverage, multiple variables, interactive analysis and downloadable data. Used together with station observations, radar, satellite information and expert interpretation where necessary, it can reduce uncertainty and help claims teams distinguish between plausible event-related damage and cases that require further review.
Explore meteoblue history+ and access historical weather data for any selected location worldwide.
-