Forecast Transparency: meteoblue Monthly Accuracy Reports
.png)
How accurate is a weather forecast – and how does that accuracy change depending on location, forecast horizon or weather situation? For organisations using weather data to support operational and strategic decisions, these are important questions. From energy and agriculture to logistics and infrastructure, knowing how a forecast performs helps users better assess the information behind their decisions.
This is why transparency in forecast performance is so important. Verification makes it possible to quantify accuracy against real observations, identify limitations and compare different forecasting approaches on a consistent basis.
With its new series of monthly Forecast Accuracy Reports, meteoblue makes these results openly accessible. The reports evaluate the meteoblue Learning MultiModel (mLM) against observations from weather stations worldwide and benchmark its performance against leading global weather models.
Forecast Accuracy Reports show how forecast performance varies by variable, continent and forecast lead time, providing customers and partners with a clearer basis for evaluating forecast data for their specific applications.
The reports currently evaluate temperature, dew point and wind speed, with editions available for January to July 2026 and new reports published every month. This continuous approach is important because forecast performance is not static: models evolve, observational networks change, and accuracy can vary depending on location and atmospheric conditions.
Measuring forecasts against observations
Forecast accuracy is assessed by comparing predictions with observations from national weather services and more than 100,000 partner-network stations. Measurements undergo strict quality control, with only around 60% of stations meeting the required standards.
In July2026, verification used 78,561 stations for temperature, 64,765 for dew point, and 30,382 for wind speed. Station coverage varies considerably by region, with dense networks in Europe and North America and more limited coverage in regions such as Africa. These differences provide important context when interpreting regional accuracy results.
.png)
Comparing forecasts with leading global models
The reportsbenchmark the meteoblue Learning MultiModel against major global forecastingsystems, including models from ECMWF,NOAA, DWD, Météo-France, the UK Met Office and Environment Canada.
Verification is performed at an hourly resolution rather than relying only on daily values. This provides a more precise assessment, as forecasts need to reproduce observed conditions at the correct time.
Three standard verification metrics are used:
- Mean Absolute Error (MAE) measures the average magnitude of forecast errors.
- Root MeanSquare Error (RMSE) gives greater weight to larger errors.
- Mean Error(ME) indicates whether a model tends to systematically overestimate orunderestimate observed conditions.
Together, these indicators provide a more complete picture of forecast performance than asingle accuracy score.
Strong performance across temperature, dew point and wind speed
The July 2026 results show strong performance from the meteoblue Learning MultiModel across all three evaluated variables.
For temperature, mLM recorded lower Mean Absolute Error than the best raw global model across all six evaluated continents. The reduction ranged from approximately 24% in Australia to 34% in Africa, with improvements of around 32–33% in Europe, Asia and North America.
A similar pattern can be seen for dew point, where mLM reduced MAE by approximately 23% to 36% compared with the best raw global model, depending on the continent.
The largest relative improvements were observed for wind speed. Here, mLM reduced MAE by approximately 29% to 44% across the six continents.
These continental averages provide a broad overview, while the reports also include maps showing how forecast errors vary geographically. This is important because forecast performance can differ considerably between regions and individual locations.
How accuracy changes further into the forecast
Forecast error generally increases with lead time: predicting conditions several days ahead is more difficult than predicting tomorrow. The monthly reports therefore examine how model performance develops from forecast day 1 through day 7.
The July results show how mLM maintains its accuracy as forecast lead time increases.
For temperature, global mLM MAE increases from 1.04°C on day 1 to 1.65°C on day 6. At day 6, mLM is still as accurate as the best raw global model on day 1, which records an MAE of 1.66°C.
For dew point, mLM MAE increases from 1.07°C on day 1 to 1.61°C on day 5. The best raw model records 1.70°C on day 1, meaning that mLM maintains a similar level of accuracy five days into the forecast.
The difference is particularly pronounced for wind speed. Global mLM MAE increases from 0.81 m/s on day 1 to 0.99 m/s on day 7, remaining below the best raw model’s day-one MAE of 1.31 m/s.
This comparison shows how long mLM maintains a similar level of accuracy as forecast lead time increases.
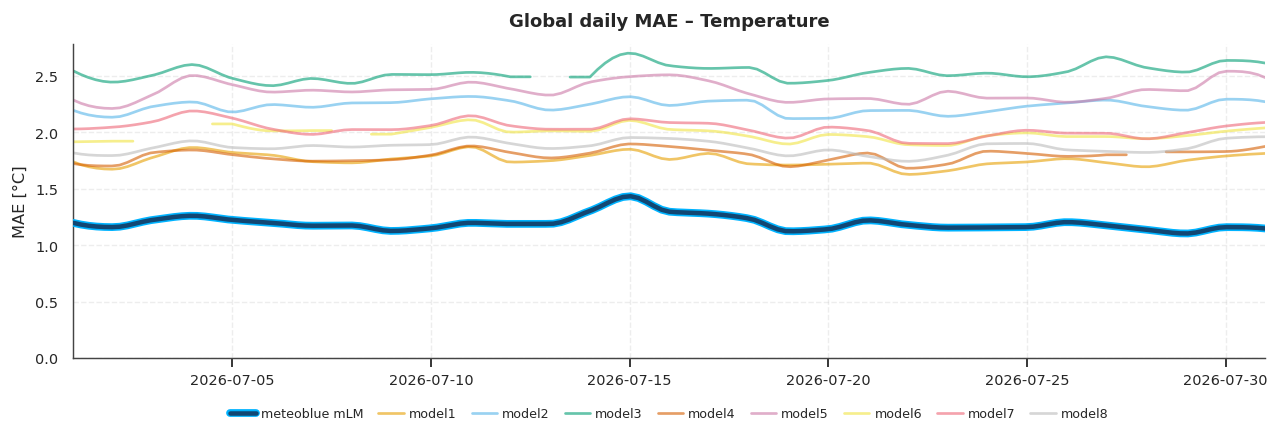
Forecast performance changes from day to day
No weather model performs equally well everywhere or in every weather situation. A model that performs particularly well today may perform differently tomorrow as weather conditions change. The reports therefore include daily error time series alongside monthly and continental summaries.
The July reports show this variability clearly. They also note that because the published figures represent continental averages, variations at individual weather stations can be considerably larger.
Although the meteoblue Learning MultiModel achieves the highest overall accuracy in these summaries by leading in most locations, no single model performs best every time.
For this reason, meteoblue also provides forecasts from other institutions alongside its own best estimate. Access to different forecasts helps users evaluate uncertainty, which can be particularly important when weather conditions affect operational decisions and risk.
Why continuous verification matters
Weather forecasting is continuously evolving. Numerical models are updated, observation networks change, and post-processing methods such as machine learning continue to develop.
A single accuracy study therefore provides only a snapshot of forecast performance.
Publishing verification results every month makes it possible to follow forecast quality over time, compare performance across regions and examine how accuracy changes with forecast lead time.
For customers and partners, this provides a clearer basis for assessing forecast data for different applications. For meteorologists and weather professionals, it offers a transparent view of how different forecasting approaches perform against observations under real-world conditions.
Forecast Accuracy Reports for January–July 2026 are available on the meteoblue dashboard, covering temperature, dew point and wind speed.