Weather data for your business
Transform your solar power operations with cutting-edge weather insights.
How We Measure Forecast Accuracy
Forecast accuracy becomes meaningful when error is measured openly. On forecast day 1, the meteoblue Learning MultiModel (mLM) achieves a global mean absolute error of 1.06 °C, 34 percent lower than the best global weather model in our monthly comparison.
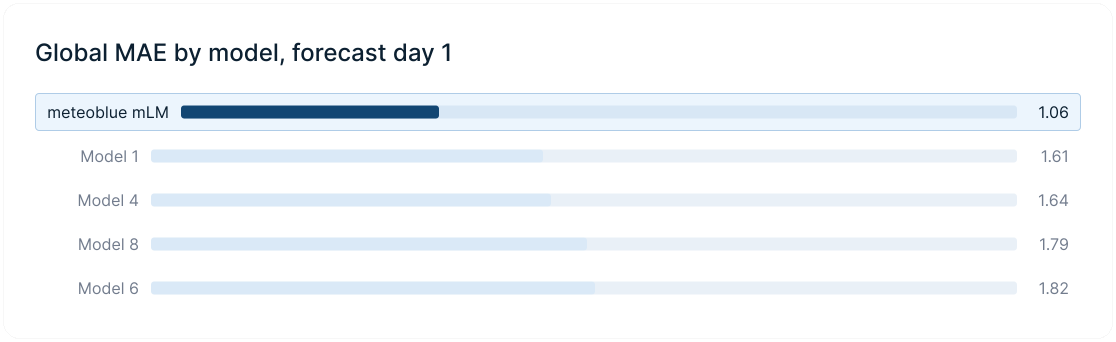
Weather Model Accuracy Comparison
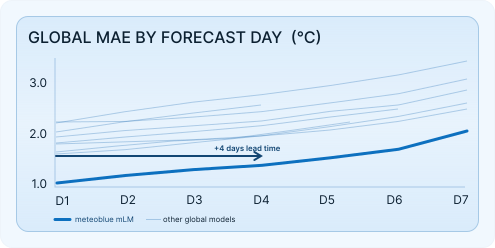
Best accuracy up to day 7
On day 5 the meteoblue mLM is still as accurate as the best global weather model is on day 1: four extra days of lead time without losing accuracy.
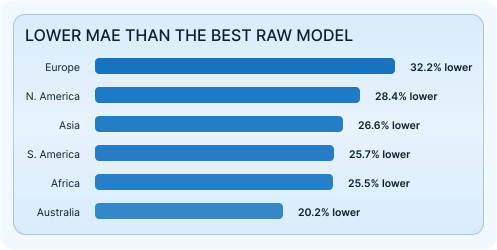
The most accurate forecast on every continent
From Europe to Australia, the meteoblue mLM lowers mean absolute error by 20 to 33 percent against the best global weather model, using one consistent methodology worldwide.
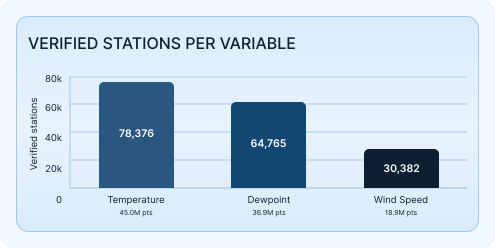
Temperature, dew point and wind speed accuracy
Each weather variable is verified separately every month. We publish the station count and data volume behind every accuracy score so the numbers can be checked.
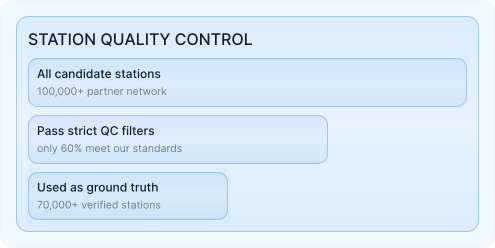
Measured against real weather stations
Actual station observations are our ground truth, not model reanalysis. Strict quality control filters unreliable measurements, and only about 60 percent of candidate stations meet the standard.
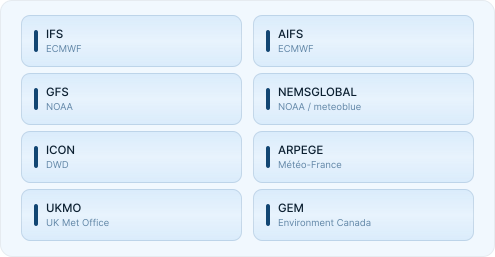
Benchmarked against the best global weather models
Our monthly weather model comparison evaluates meteoblue against IFS and AIFS (ECMWF), GFS (NOAA), NEMSGLOBAL (NOAA/meteoblue), ICON (DWD), ARPEGE (Météo-France), UKMO (UK Met Office) and GEM (Environment Canada).
How to Read These Numbers
We take what a weather station recorded, hour by hour, and subtract what was predicted. Everything shown below is calculated from that difference.
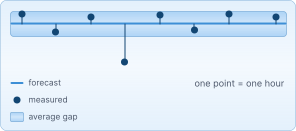
Mean absolute error
The typical size of the gap between forecast and measurement, in the unit of the variable itself. If the MAE for air temperature is 1 °C, a typical hour was off by about 1 °C. Use it to answer how wrong the forecast normally is.
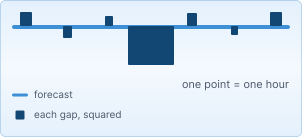
Root mean square error
The same gaps, but each one is squared before averaging, so a single large miss counts far more than several small ones. RMSE is always greater than or equal to MAE, and the distance between the two shows how often the forecast misses badly rather than slightly. Use it when rare large errors cost more than frequent small ones.
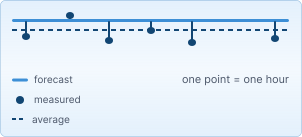
Mean error, or bias
Whether the forecast leans high or low over time. Near zero means over- and under-predictions cancel out. A persistent value means a systematic lean, which can often be calibrated out once you know it is there. Use it when setting absolute thresholds.
How to interpret the results
June 2026 Verification Results
Mean absolute error in °C for air temperature, computed at hourly resolution against verified station measurements. Lower is better.
Where a meteoblue Forecast Comes From
Measurements and observations show what is happening right now, dozens of weather models supply the physics, and the mLM turns all of them into one forecast for your location.
One forecast for your coordinates
What Happens to the Data Before You See It
Buying weather data rarely means buying a different model. Almost every model behind a meteoblue forecast is available to other providers too. The difference is made in the steps that turn many conflicting forecasts into one.
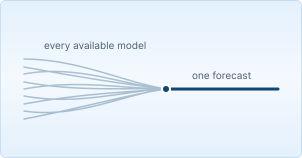
meteoblue Learning MultiModel
Weighs every available model by how it behaves at your location in each weather situation, and combines contradictory forecasts into one consensus. Where measurements exist nearby it learns from them; where none do, further post-processing still improves on the raw models.
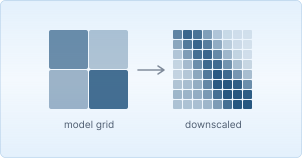
Downscaling
Adds the local detail coarser models cannot resolve. Topography, land cover and, for variables such as wind speed, physical models turn one value for a wide grid cell into a forecast for your exact point.
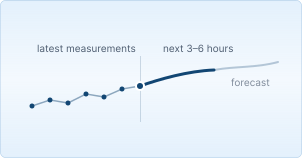
Nowcasting
Combines the downscaled forecast with the newest observations from radar, satellites and ground stations to predict the next 3 to 6 hours, updated every 5 to 10 minutes. For that short window, nowcasts are the most accurate forecasts available.
How they work together
Frequently Asked Questions
In our monthly benchmark the meteoblue Learning MultiModel (mLM) has the lowest mean absolute error in the comparison, at 1.06 °C on forecast day 1 against 1.61 °C for the best raw model. The mLM is not a weather model in its own right: it is a post-processed consensus built from the raw models, measurements and machine learning. Among the raw global models the differences are smaller and the ranking shifts between regions and variables, which is why we combine them rather than relying on a single one.
Forecast error grows with lead time, but not evenly. In June 2026 the meteoblue Learning MultiModel had a mean absolute error of 1.06 °C on day 1, 1.53 °C on day 5 and 2.03 °C on day 7, for air temperature measured hourly against verified station data. For comparison, the best raw global model reached 2.44 °C on day 7. The practical difference is not the decimal but the horizon: our day 5 forecast is about as accurate as the best raw model's day 1 forecast.
Actual weather station observations, not model reanalysis. Our independent baseline spans national weather services plus a partner network of more than 100,000 stations. Strict quality control filters out unreliable measurements before anything enters the comparison, and only about 60 percent of candidate stations meet the standard. For temperature in June 2026 that left 78,376 stations and roughly 45 million hourly measurements.
Yes. For a quick look at any point on the map, the short-term verification meteogram at meteoblue.com/en/weather/forecast/verificationshort plots our forecast against the nearest station for the last 3 to 10 days. Beyond that we can access verification metrics for any individual station worldwide in real time, so accuracy can be checked at the locations that actually matter to you rather than at a global average. Contact us with your coordinates or station list and our team will pull the scores for your sites.
Considerably. Topography, land cover and the frequency of small-scale weather all affect how predictable a place is, and measurement density varies just as much. For temperature in June 2026 the verification drew on 43,903 stations in North America and 22,163 in Europe, against 1,363 in Africa. That is why we publish the station count per continent rather than a single global average, and why we can produce verification for your specific sites on request.
Soluciones personalizadas
Transform your operations with high-precision weather data and the most accurate weather forecast.
