Intelligence climatique en temps réel pour des villes axées sur les données
Combinez des réseaux de capteurs IoT avec une modélisation haute résolution pour cartographier les îlots de chaleur urbains, valider les mesures d’adaptation et mobiliser les citoyens.




From Measurements to Actionable Climate Information
meteoblue supports cities through the whole chain: from planning the sensor network to delivering street-level climate data into the platforms your teams already use.
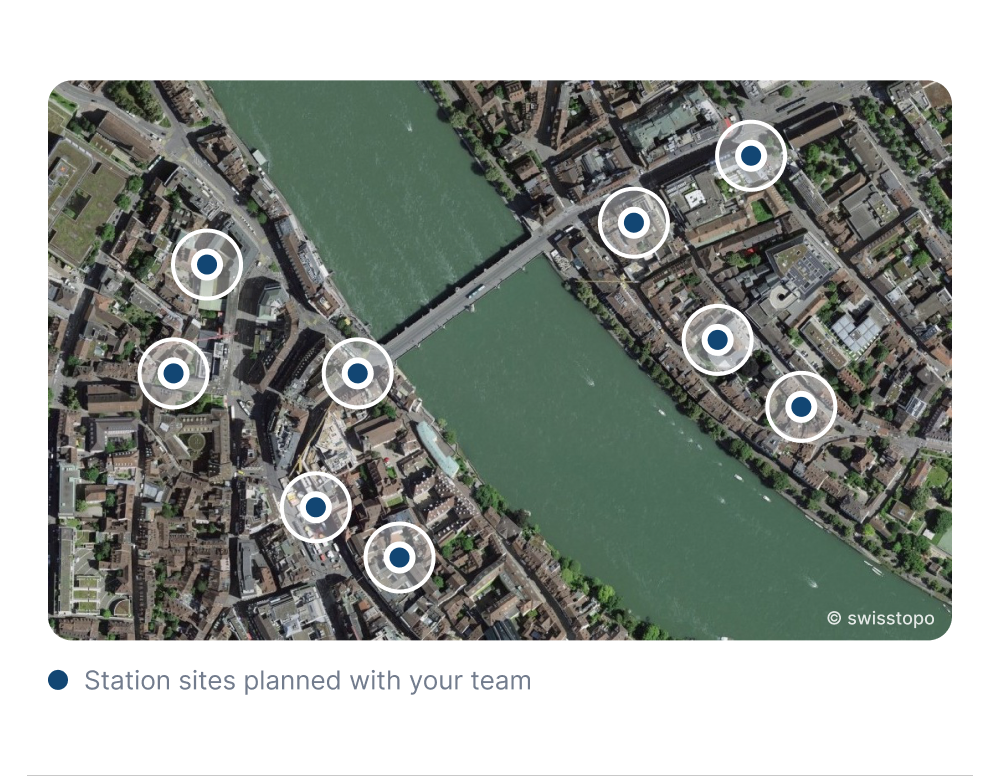
Plan the Measurement Network With Us
Deciding where sensors go, how many a city needs and which sites are representative is often the hardest part of a measurement project.
meteoblue supports cities from the first site survey to long-term operation, including our largest city network with more than 150 stations.
- Network design: Number of stations and network layout for your city.
- Sensor placement strategy: Representative sites for heat, green space and traffic.
- Deployment planning: Hardware, mounting and data connection.
- Validation and operation: Checks after installation, then monitoring and maintenance.
Measurements Stored, Checked and Ready to Use
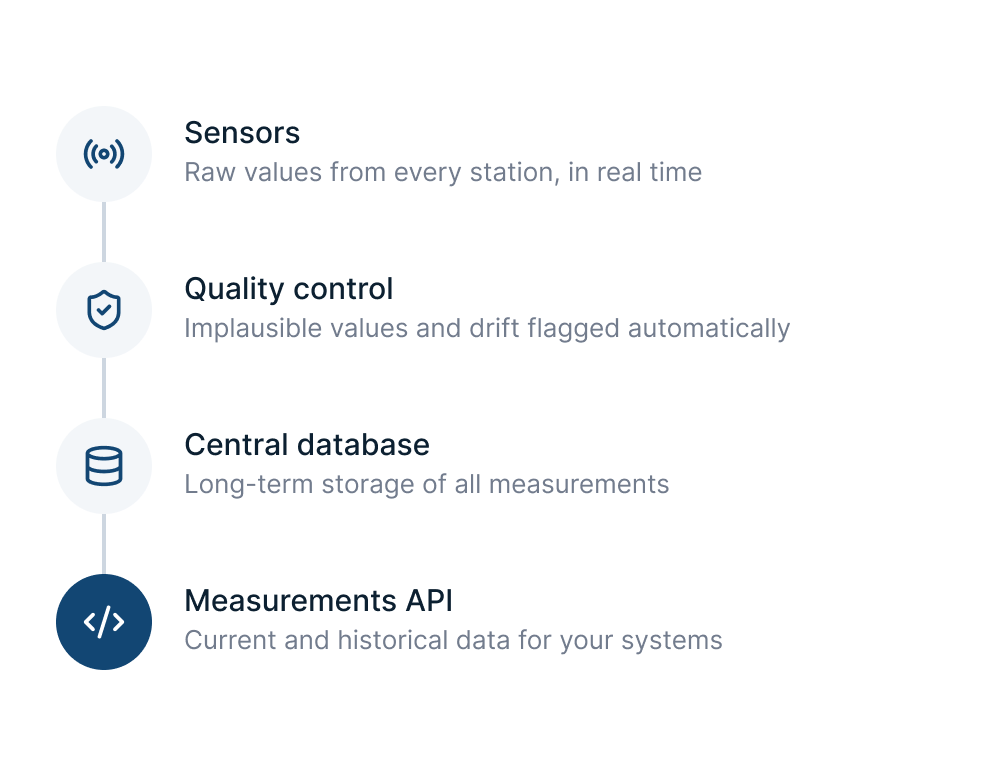
Sensor measurements are ingested in real time, quality-controlled automatically and stored in a central database.
Your team accesses current and historical values through the Measurements API, without running its own data infrastructure.
- Real-time ingestion: A continuous data stream from every station.
- Automatic quality control: Implausible values and drift are flagged.
- Central database: Long-term storage of all measurements.
- Measurements API: Current and historical data for your own systems.
Urban Climate Models Validated by Local Measurements
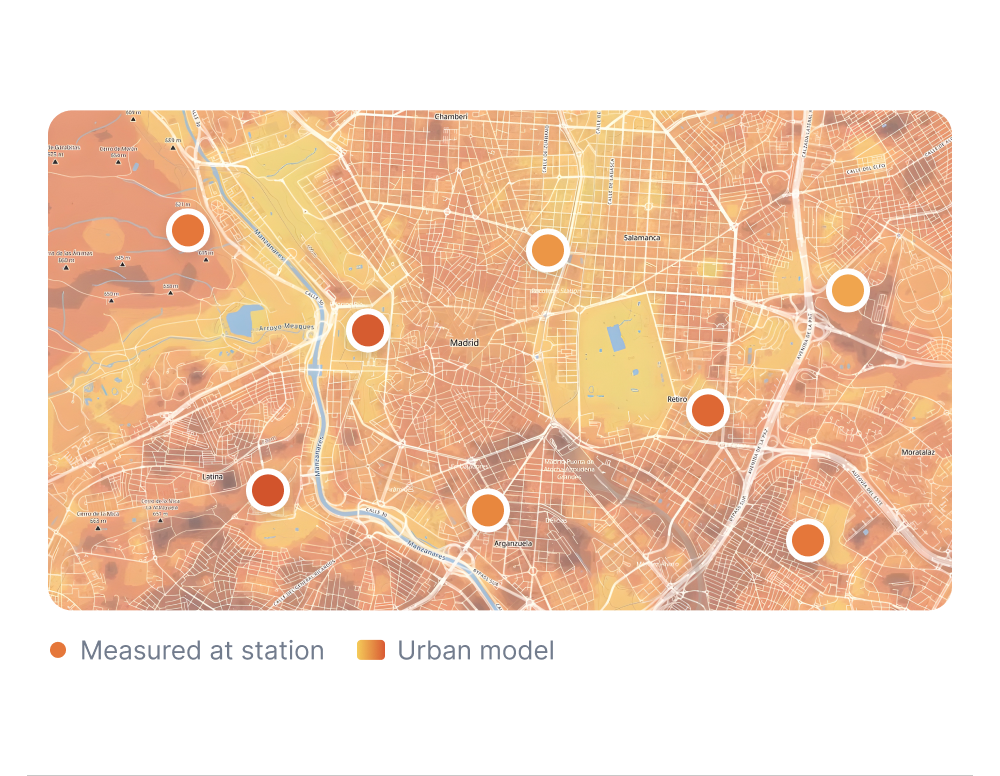
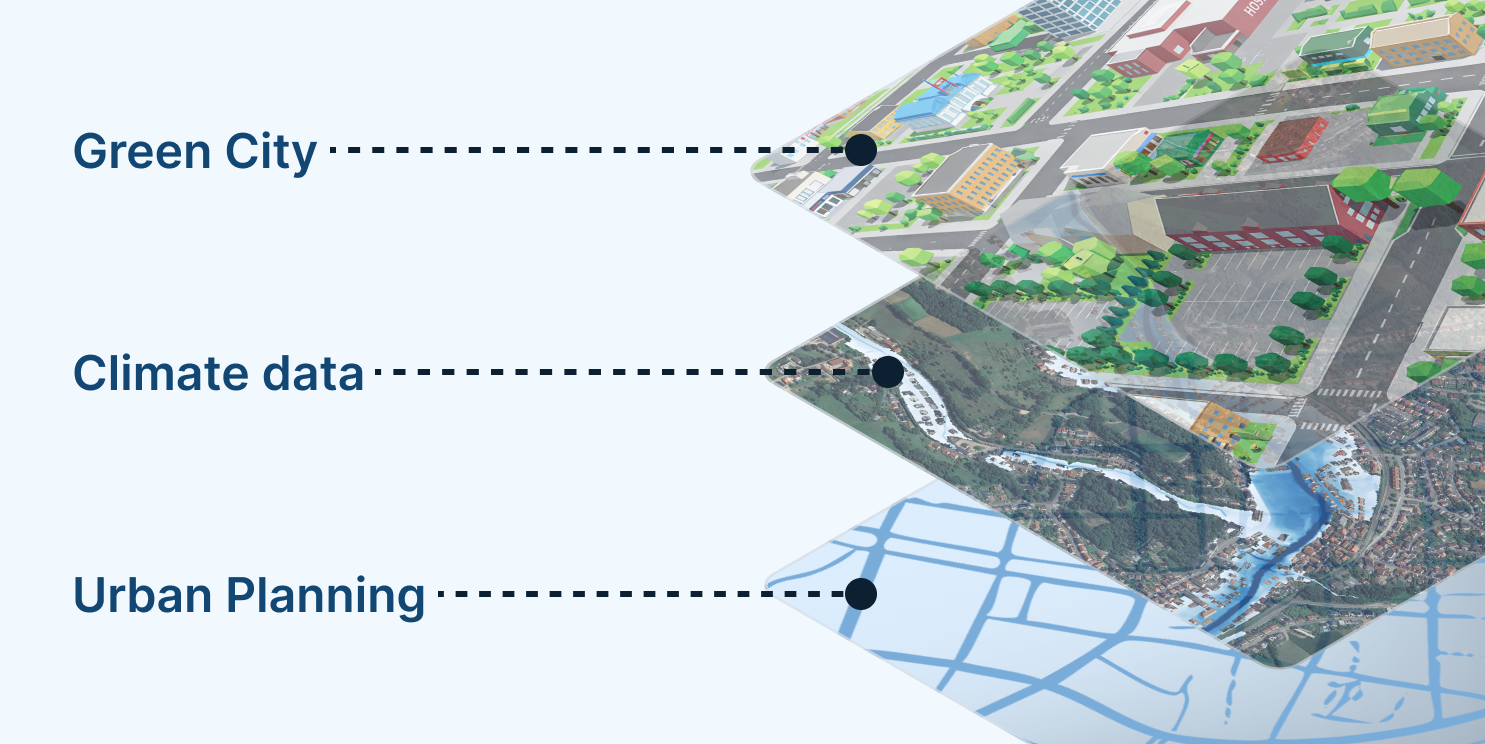
The urban climate model covers the city at 10 m resolution. It shows conditions in places where no sensor stands.
Where local IoT stations exist, their measurements are used to validate and refine the temperature model. The result is street-level climate information you can trust across the whole city.
- Urban climate model: Complete coverage of the city at 10 m.
- Local measurements: Ground truth at each station in the network.
- Validated climate information: Street-level data and forecasts up to 7 days ahead.
- Continuous refinement: New measurements keep the temperature model up to date.
Urban Climate Layers for Every Street
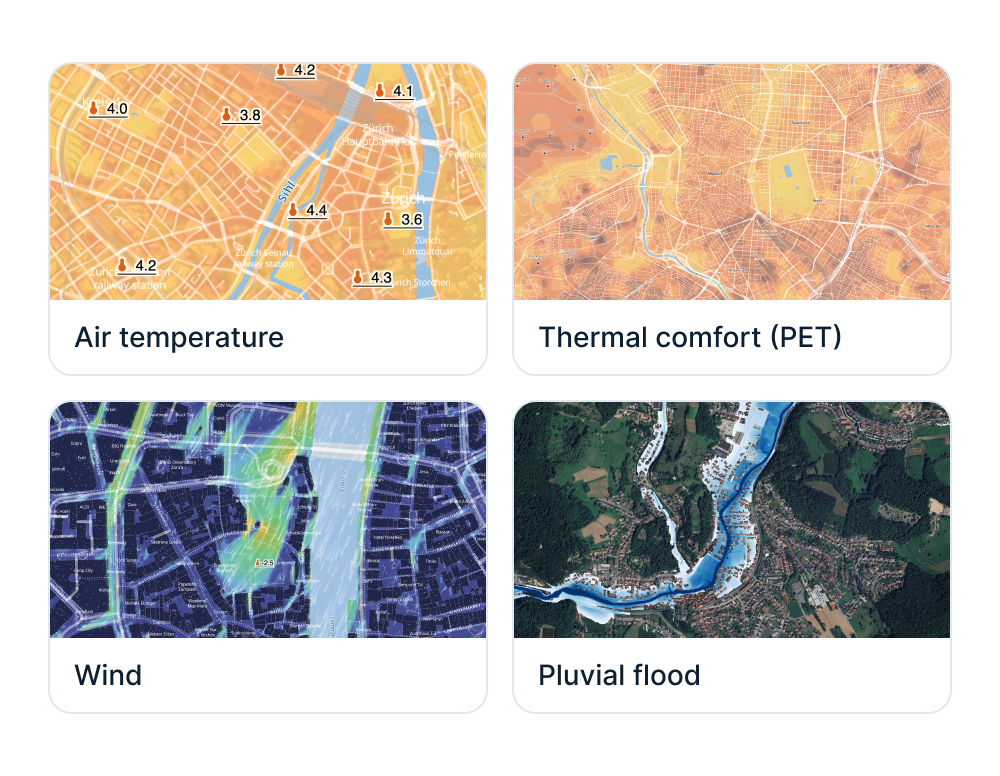
The model and the measurements produce four core layers as maps and time series, with forecasts up to 7 days ahead for temperature, thermal comfort and wind.
Threshold-based alerts notify your teams by API, email or dashboard. The indicators also support funding applications, adaptation concepts and climate adaptation laws.
- Air temperature: Heat islands and cool spots at 10 m resolution.
- Thermal comfort (PET): Heat stress as people feel it, street by street.
- Wind: Speed and direction at down to 2 m resolution.
- Pluvial flood: Areas where heavy rain collects on the surface.
Urban Climate Data Ready for Smart City Platforms
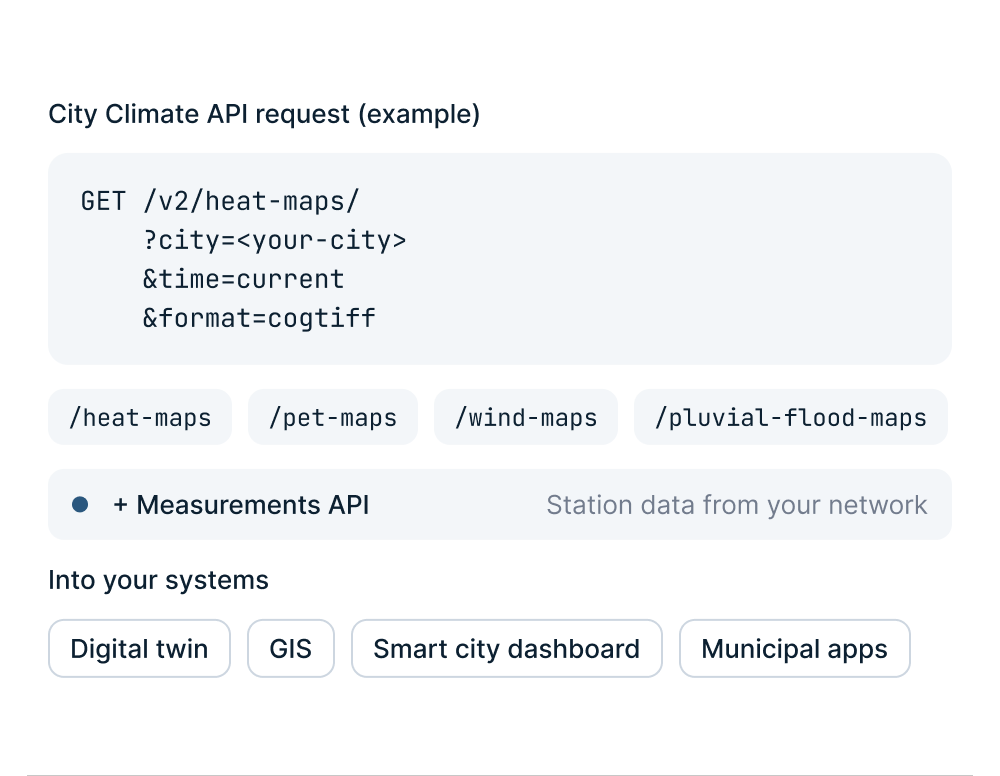
Urban climate information is delivered through two APIs, so it fits into digital twins, GIS software, operational dashboards and municipal applications.
Maps are available for the current time or a chosen point in time, so dashboards and planning tools always work with up-to-date data.
- City Climate API: Heat, thermal comfort (PET), wind and pluvial flood maps for your city.
- Measurements API: Current and historical observations from your sensor network.
- Standard formats: GeoTIFF for GIS and images for web and dashboards.
Smart Cities commencent avec les solutions meteoblue
Prévisions et alertes hyperlocales
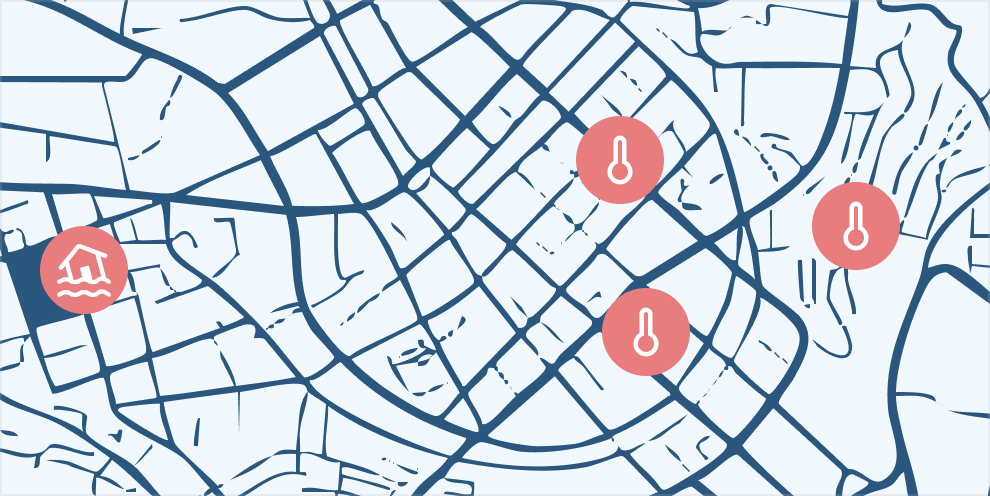
Les prévisions et alertes hyperlocales combinent des observations de capteurs denses avec des modèles à haute résolution afin de fournir des prévisions au niveau de la rue pour différentes variables météorologiques. Les alertes basées sur des seuils s'activent lorsque les conditions dépassent les limites fixées, permettant des décisions rapides et conscientes des risques via API, e-mail ou tableau de bord.
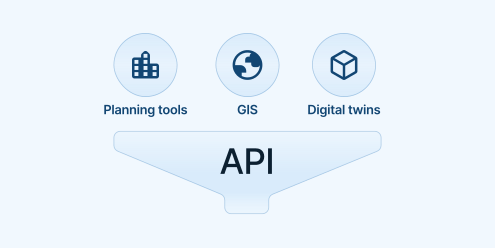
Intégration transparente dans les jumeaux numériques et les tableaux de bord des villes intelligentes
Nos API et formats de données sont compatibles avec les logiciels de ville intelligente, les systèmes SIG et les tableaux de bord de planification.

Conçu pour les décideurs et un impact local
Nous transformons des données climatiques complexes à haute résolution en résultats prêts à l’emploi, permettant aux décideurs des villes intelligentes d’agir.
30+
Villes utilisant activement les systèmes climatiques urbains de meteoblue
100+
Cartes urbaines déployées publiquement dans le monde entier
150+
Stations dans notre plus grand réseau climatique urbain
meteoblue est un partenaire parfaitement adapté, doté d'une expertise en capteurs météorologiques et en gestion des données. Notre partenariat nous a aidés à communiquer efficacement aux urbanistes la valeur des mesures visant à réduire la chaleur dans les zones urbaines, tandis que l'intégration de la technologie IoT fait progresser notre objectif de favoriser des environnements urbains durables et résilients au climat.

Explorez nos API météo

Premium Weather API
Prévisions haute résolution, données météorologiques historiques et météogrammes interactifs pour n’importe quel emplacement dans le monde.

Weather Maps API
Plus de 80 couches et tuiles de cartes météo dynamiques avec une couverture mondiale.

City Climate API
Données et indicateurs climatiques à l'échelle urbaine pour la chaleur, le risque d'inondation et le confort thermique afin de soutenir la planification et l'analyse des villes résilientes.

Solutions personnalisées
Transformez votre Smart City grâce à des informations météo de pointe.
