Concept d'adaptation climatique
Élaborez des stratégies d’adaptation robustes à partir de projections climatiques haute résolution, de modèles éprouvés de bilan énergétique de surface et de données de mesure validées.




From Climate Evidence to Local Action
Climate adaptation concepts connect scientific analysis with practical planning. meteoblue supports cities and counties through every stage, from assessing local climate risks to defining adaptation measures and monitoring their effect, with climate modelling, measurement networks and planning and engineering partners.
5+
Mesures d'adaptation climatique validées
10 +
Concepts d'urbanisme mis en œuvre avec succès.
100 +
Cartes urbaines disponibles publiquement sur meteoblue.com
Understand Your Climate, Today and Tomorrow
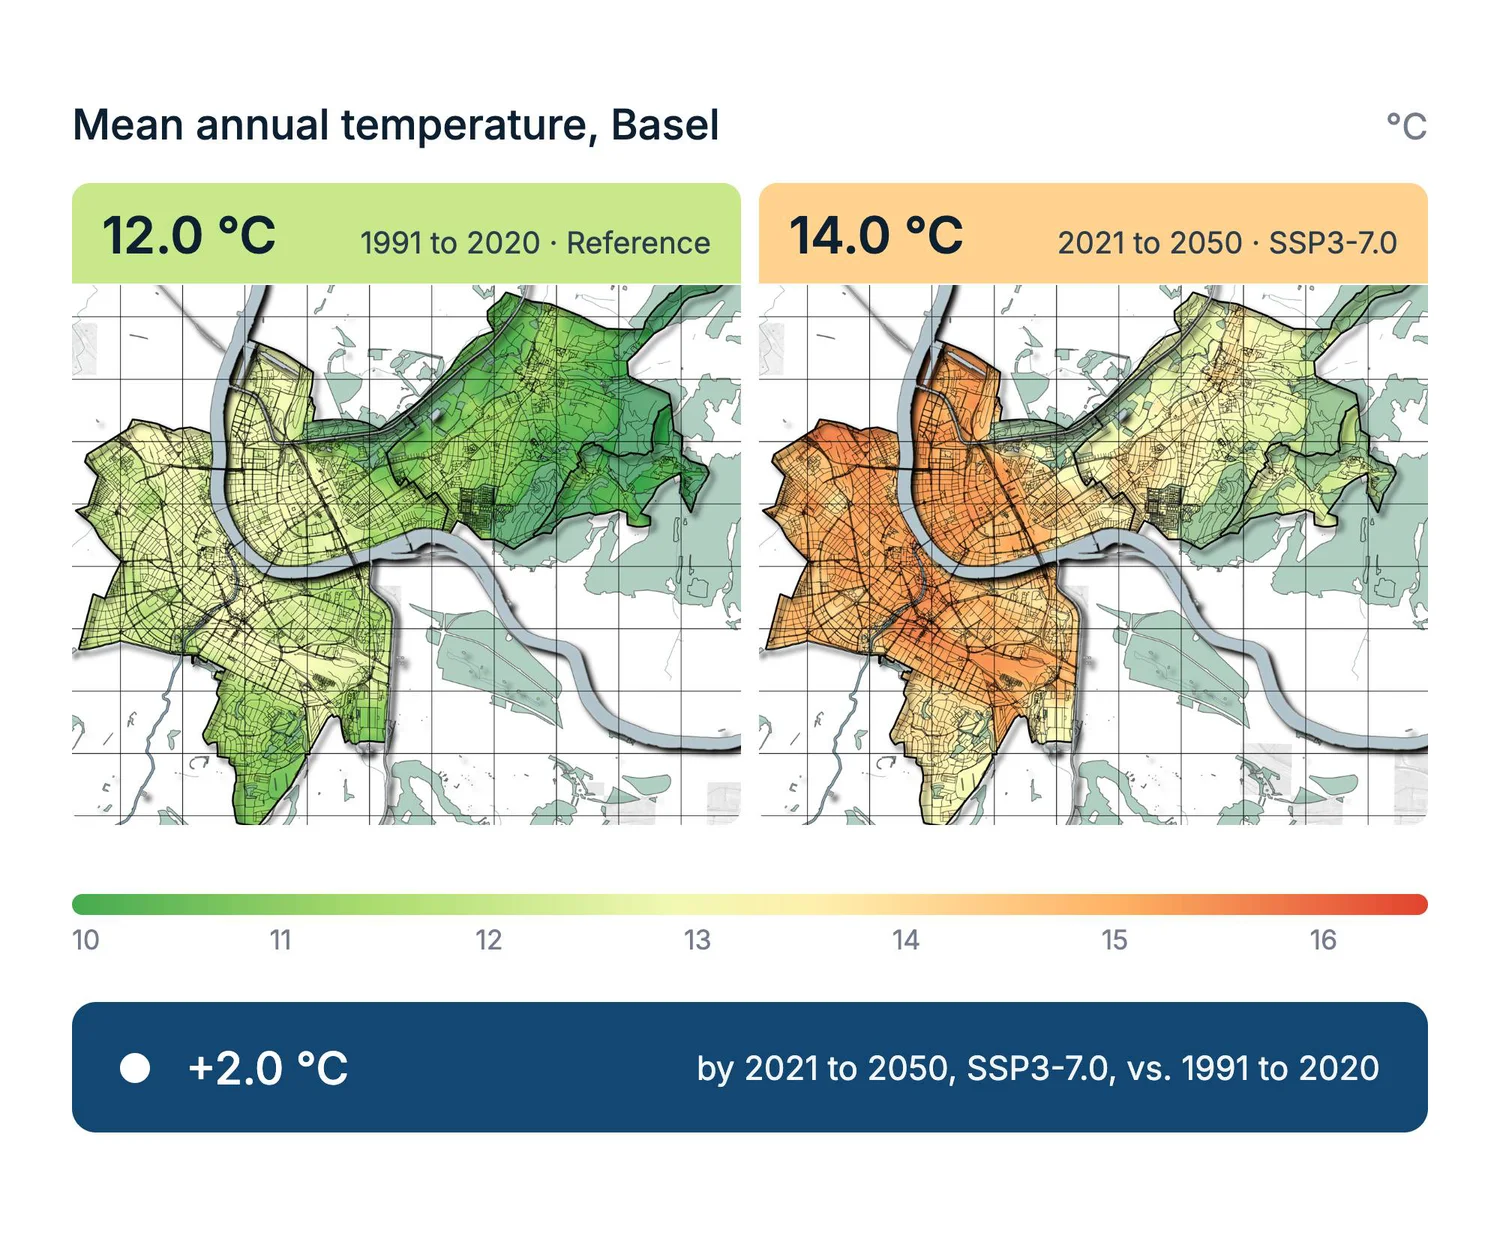
A clear climate baseline shows how local conditions have changed and what may lie ahead. Historical data, observations and climate projections give cities and counties the evidence they need to prepare for future challenges.
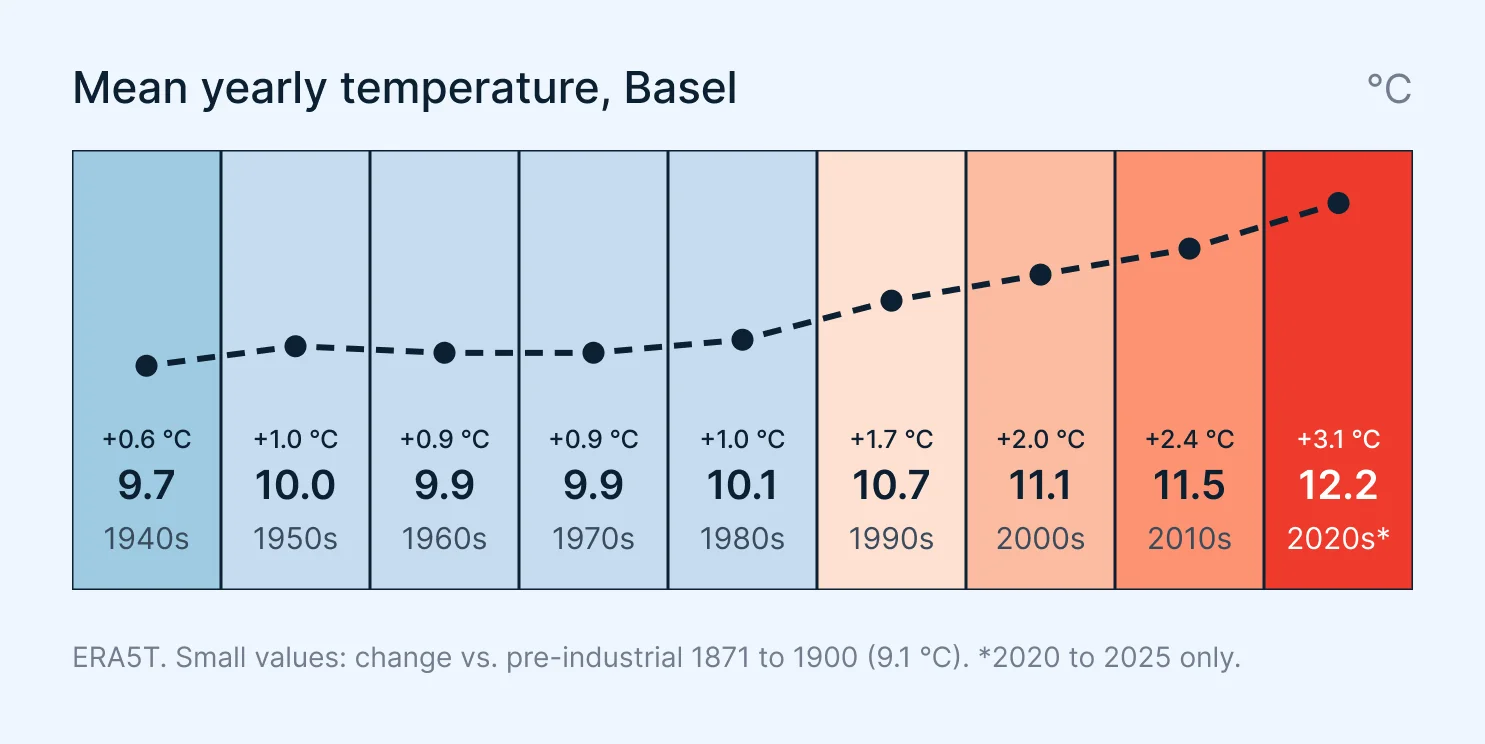
- Past and present: Climate data since 1940 to establish local trends.
- Local observations: Measurement records that describe current conditions and complement the historical data.
- Future changes: Climate projections compared across emission scenarios and planning horizons, including high-resolution maps of the future urban climate.
Understand Local Climate, Preserve Key Functions
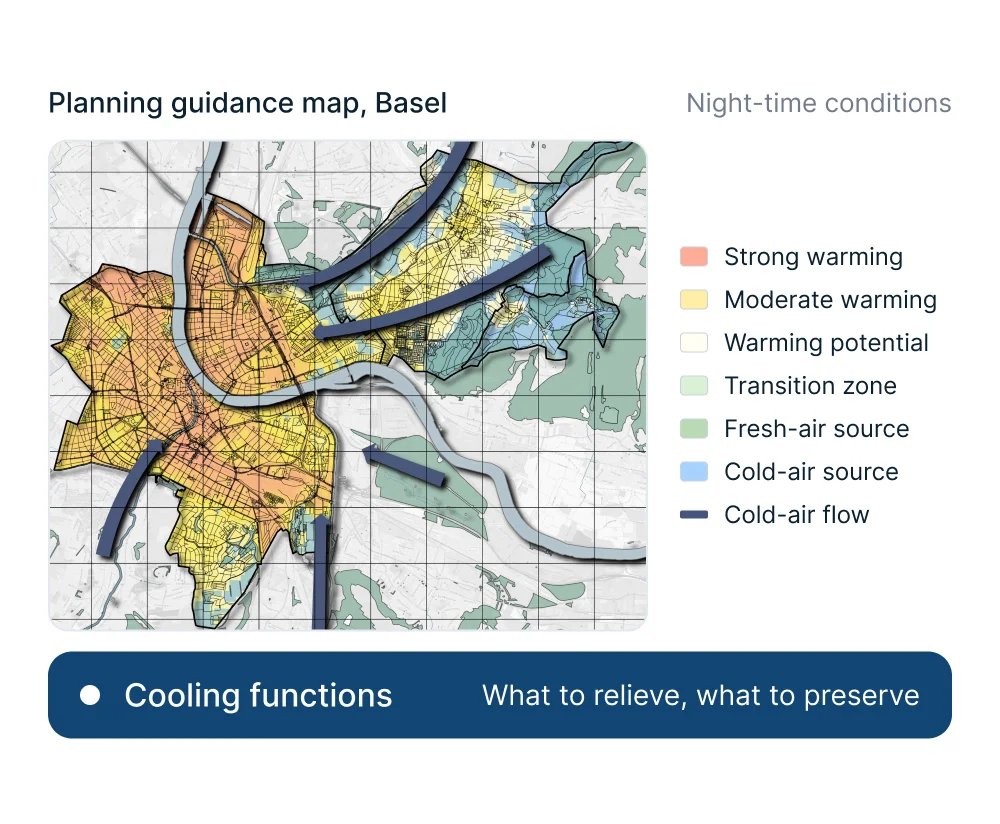
High-resolution urban climate analyses show how buildings, vegetation and terrain shape heat stress and cold-air flows. Planning guidance maps build on these results and show which areas need relief and which cooling functions must be preserved.
- Urban climate analysis: Thermal comfort, night-time cooling, cold-air generation and airflow corridors.
- Planning guidance maps: Areas that need cooling, important cold-air corridors and spaces sensitive to land-use change.
- Resolution: Urban climate maps at 10 m from the meteoblue City Climate Model.
Find Where Adaptation Matters Most
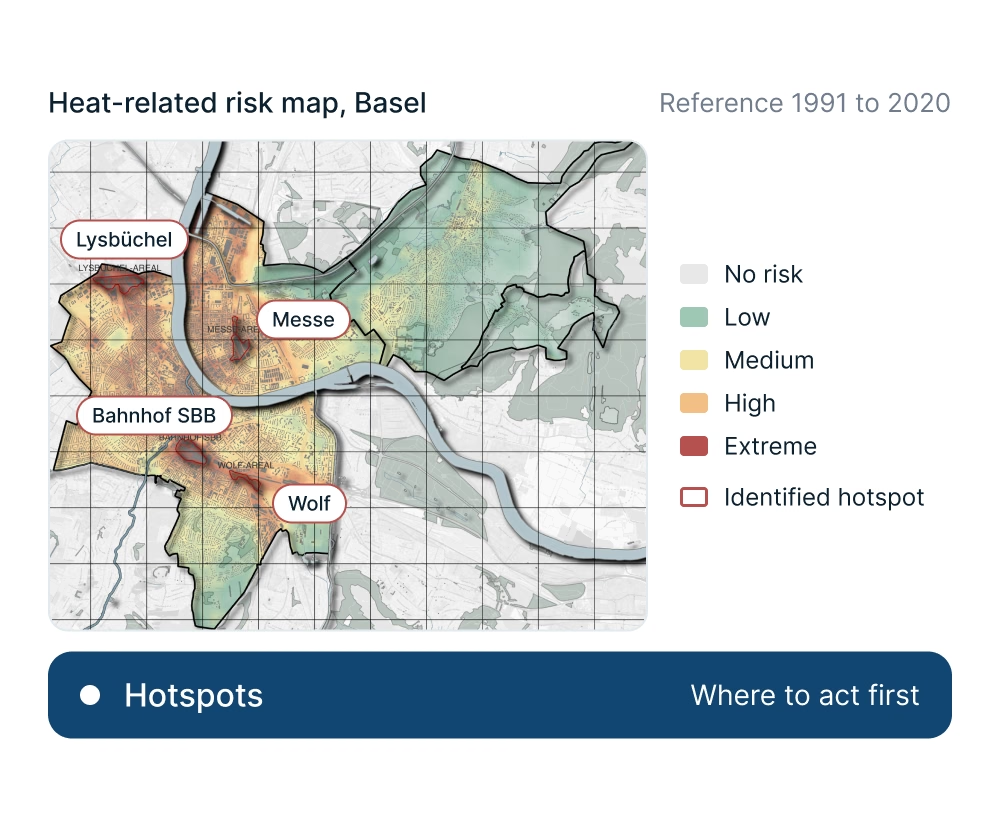
Climate hazards affect places and communities differently. Combining climate information with population, land-use and infrastructure data shows who and what is at risk, and where adaptation is most urgent.
- Climate hazards: Heat, drought, heavy rainfall, flooding and wind extremes under current and future conditions.
- Exposure and vulnerability: Affected populations, infrastructure and ecosystems, and how susceptible they are to harm.
- Risk priorities: Risks compared across locations and sectors to identify hotspots and priority needs.
Develop an Adaptation Strategy and Action Plan
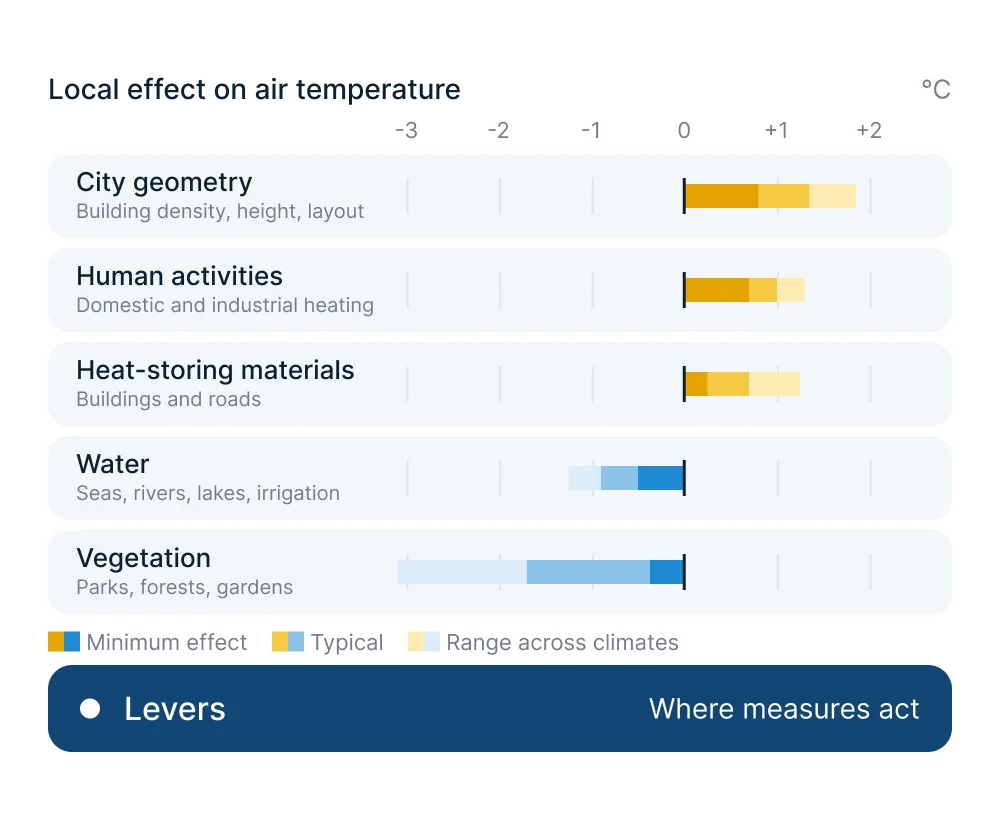
Together with municipalities and specialist partners, climate risks are translated into clear goals and targeted measures, with priority on nature-based solutions. Additional simulations can assess the effect of selected options.
- Strategy: Adaptation goals across relevant sectors, aligned with existing local plans.
- Measures: Nature-based, technical and organisational solutions, assessed for effectiveness, feasibility, synergies and conflicts.
- Implementation: Prioritised measure profiles with responsibilities, timelines, resource needs and indicators of success.
Shape Climate Adaptation Together
Participation and clear communication bring residents, local experts, municipal departments and decision-makers into the process, combining local knowledge with technical expertise.
- Participation: Residents and stakeholders develop and discuss adaptation measures together.
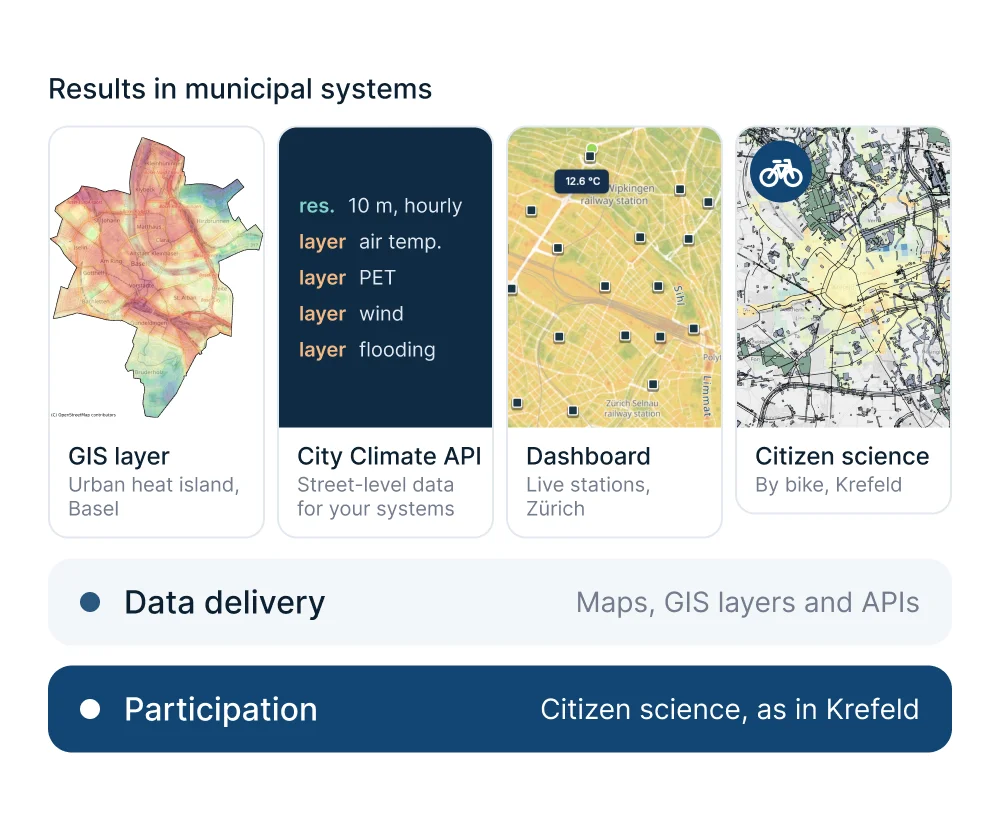
- Communication: Use urban data platforms, interactive maps and dashboards and public events to make planned measures accessible.
- Citizen science: Participatory projects in which residents measure their local climate.
Measure the Effect of Adaptation
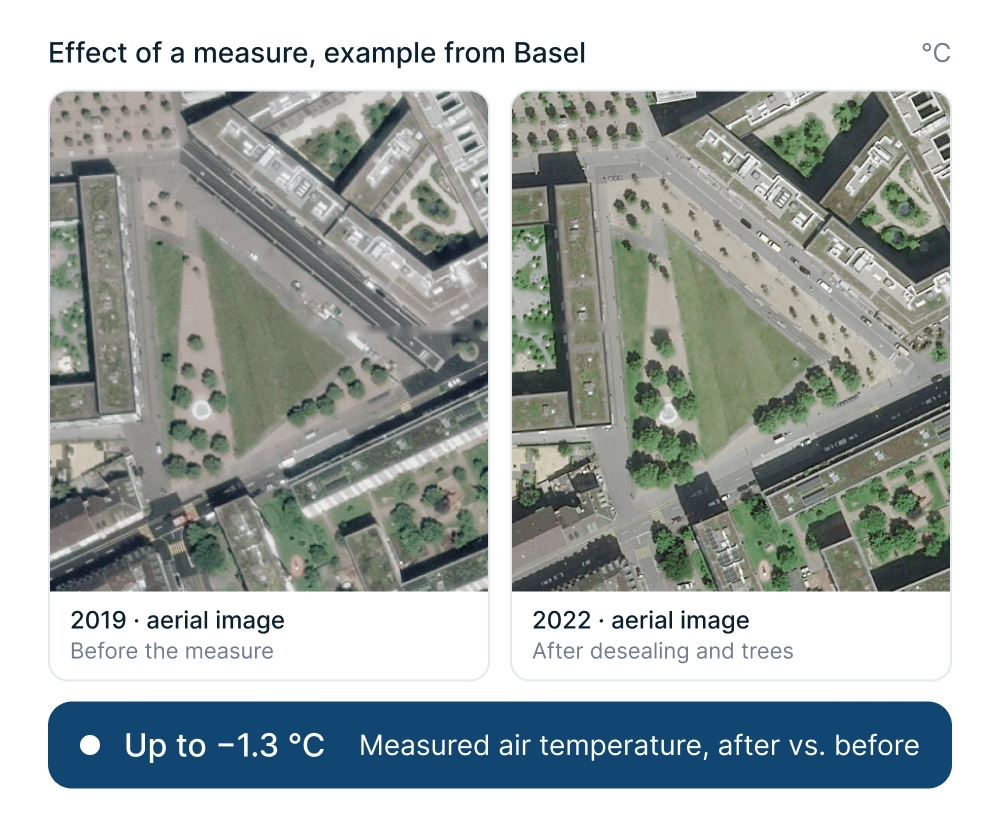
A long-term monitoring plan combines clear indicators with a representative measurement network and real-time quality control. It shows how the local climate develops and whether adaptation measures work. Regular evaluations guide improvements, and accessible results keep residents informed.
- Quality control: Incoming observations checked in real time for reliable data.
- Evaluation: Quality-controlled measurements and comparisons show whether measures achieve their intended effect.
- Communication: Public dashboards, maps and updates make progress visible to residents.
Pourquoi les villes choisissent meteoblue pour leur stratégie d'adaptation
Plage temporelle étendue
Nous fournissons une plage temporelle étendue de 1940 à 2100 afin de couvrir toute la période d'évolution. Cela donne la possibilité de voir les changements historiques et d'évaluer les futurs changements climatiques.
Haute résolution
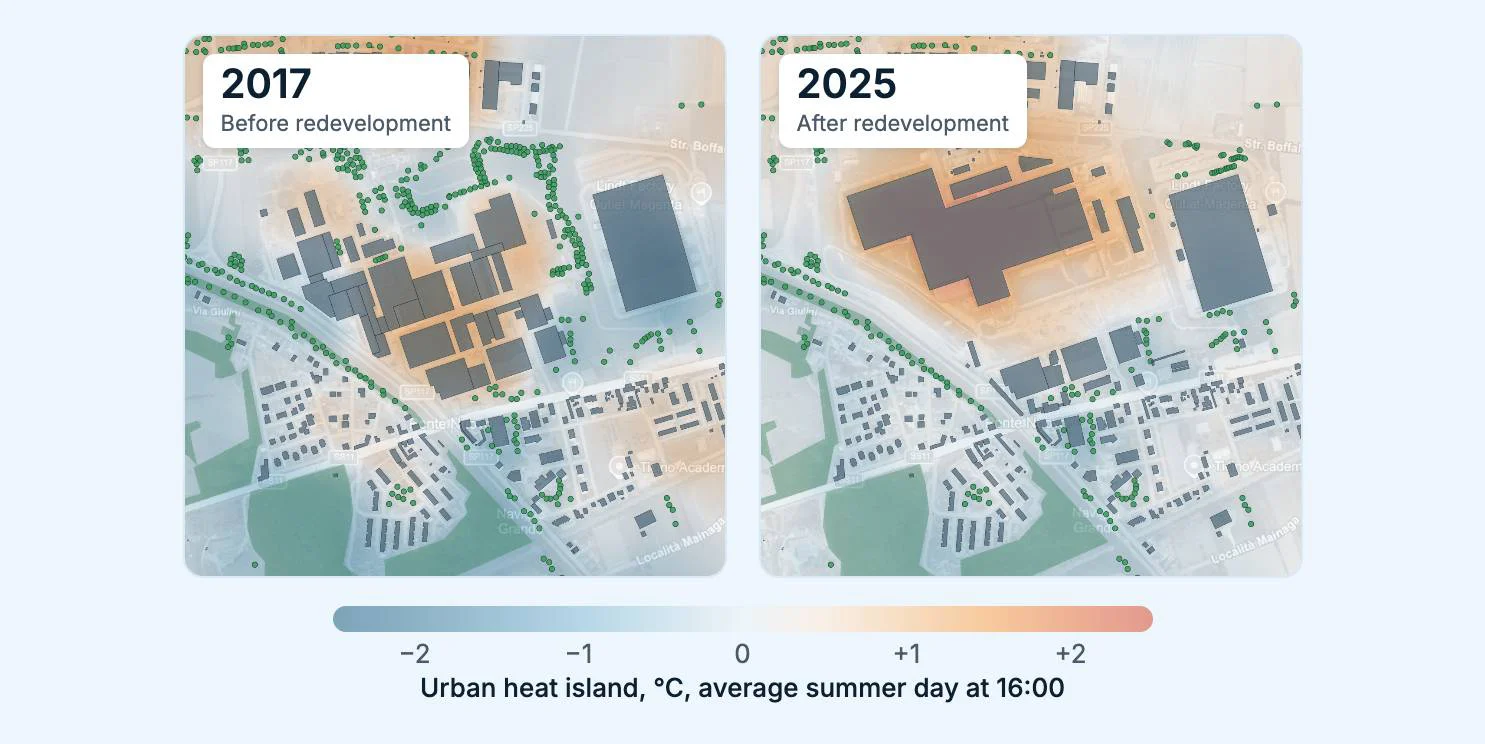
meteoblue propose différentes techniques de downscaling pour garantir des analyses à l’échelle de la rue. Cette granularité permet de détecter des points chauds climatiques urbains très locaux afin de définir des zones d'adaptation climatique.
Simulation d'adaptation climatique
Nous proposons des solutions de simulations 3D d'adaptation climatique afin de visualiser et de quantifier les effets des mesures d'adaptation climatique sur la température locale, le confort thermique et les régimes de vent.
Built for Municipal Requirements
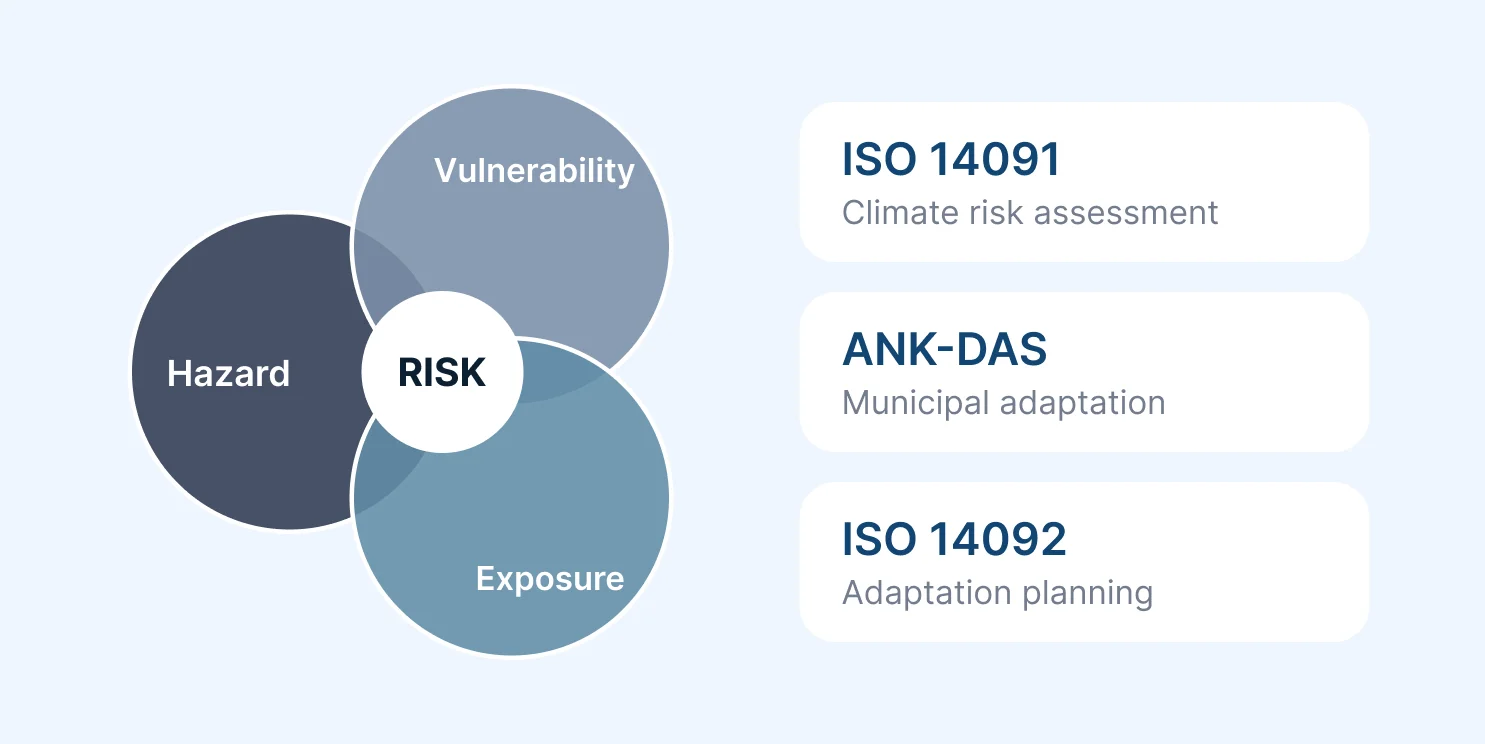
The workflow follows established standards and is tailored to applicable legislation, planning guidelines and funding requirements. This includes ISO 14091 and ISO 14092, alongside relevant national and regional frameworks.
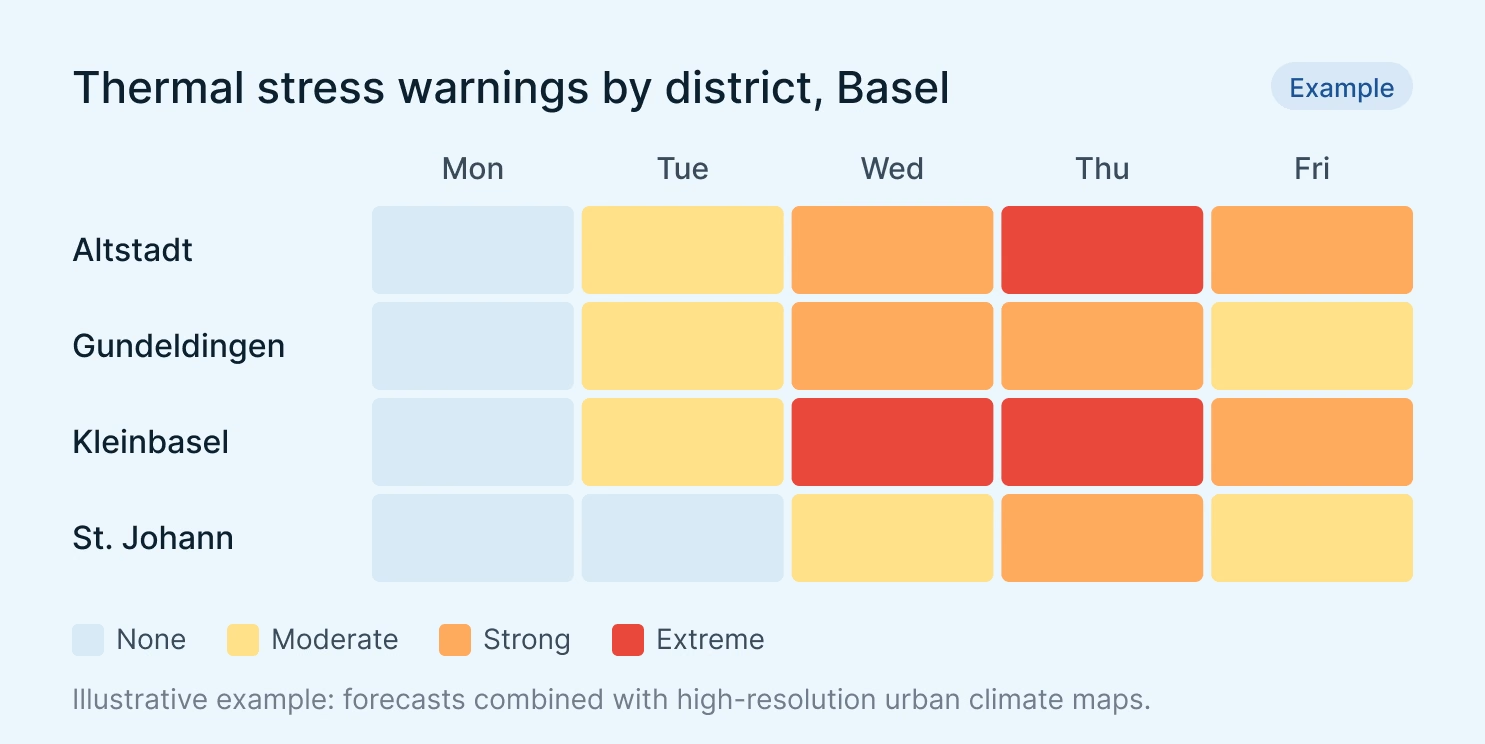
Nous avons commencé avec un réseau de stations de mesure pour surveiller le climat urbain à Krefeld. Aujourd'hui, nous disposons d'une analyse complète du climat urbain réalisée par meteoblue et nous recevons des prévisions de température qui incluent désormais des avertissements de chaleur pour les groupes de population sensibles à la chaleur.

Nous proposons des solutions sur mesure pour la résilience urbaine !
Pour les Smart Cities
Intégrez les API de meteoblue dans des tableaux de bord IoT pour fournir des informations environnementales enrichies, des alertes prédictives et des superpositions de risques contextuels.
Pour la Planification Urbaine
Reliez les mesures des capteurs aux projections à long terme pour orienter la planification d'infrastructures adaptatives, l'élaboration de politiques et l'atténuation de la chaleur urbaine.
Pour la santé publique
Combinez les données de capteurs ouverts avec des modèles météorologiques haute résolution pour la santé urbaine, la qualité de l'air ou la recherche sur le microclimat et les études d'impact.
Develop Your Climate Adaptation Concept with meteoblue
Développez votre concept d'adaptation climatique avec des données fiables sur le climat urbain.
