Weather Data for Business: Understanding the Main Data Sources
Weather data supports decisions across agriculture, renewable energy, infrastructure and many other sectors, but the term covers several fundamentally different types of information. A measurement, a forecast, a reanalysis value and a climate normal may describe the same variable at the same location, yet they are produced differently and are intended for different purposes.
The usefulness of any dataset therefore depends on how it was generated and which period it represents. A local measurement captures conditions at a particular place and time, while a model can estimate conditions where no instrument is available, project how the atmosphere may evolve, or reconstruct weather that occurred decades ago. For business applications, the appropriate source depends on whether the task is to document an event, plan operations, analyse historical variability or assess longer-term conditions.
Four broad categories provide a practical framework: observations describe measured or detected conditions, forecasts estimate future weather, reanalyses combine observations and models to reconstruct the past, and climatologies summarise conditions over many years to provide a statistical reference.
Observations: measuring current conditions
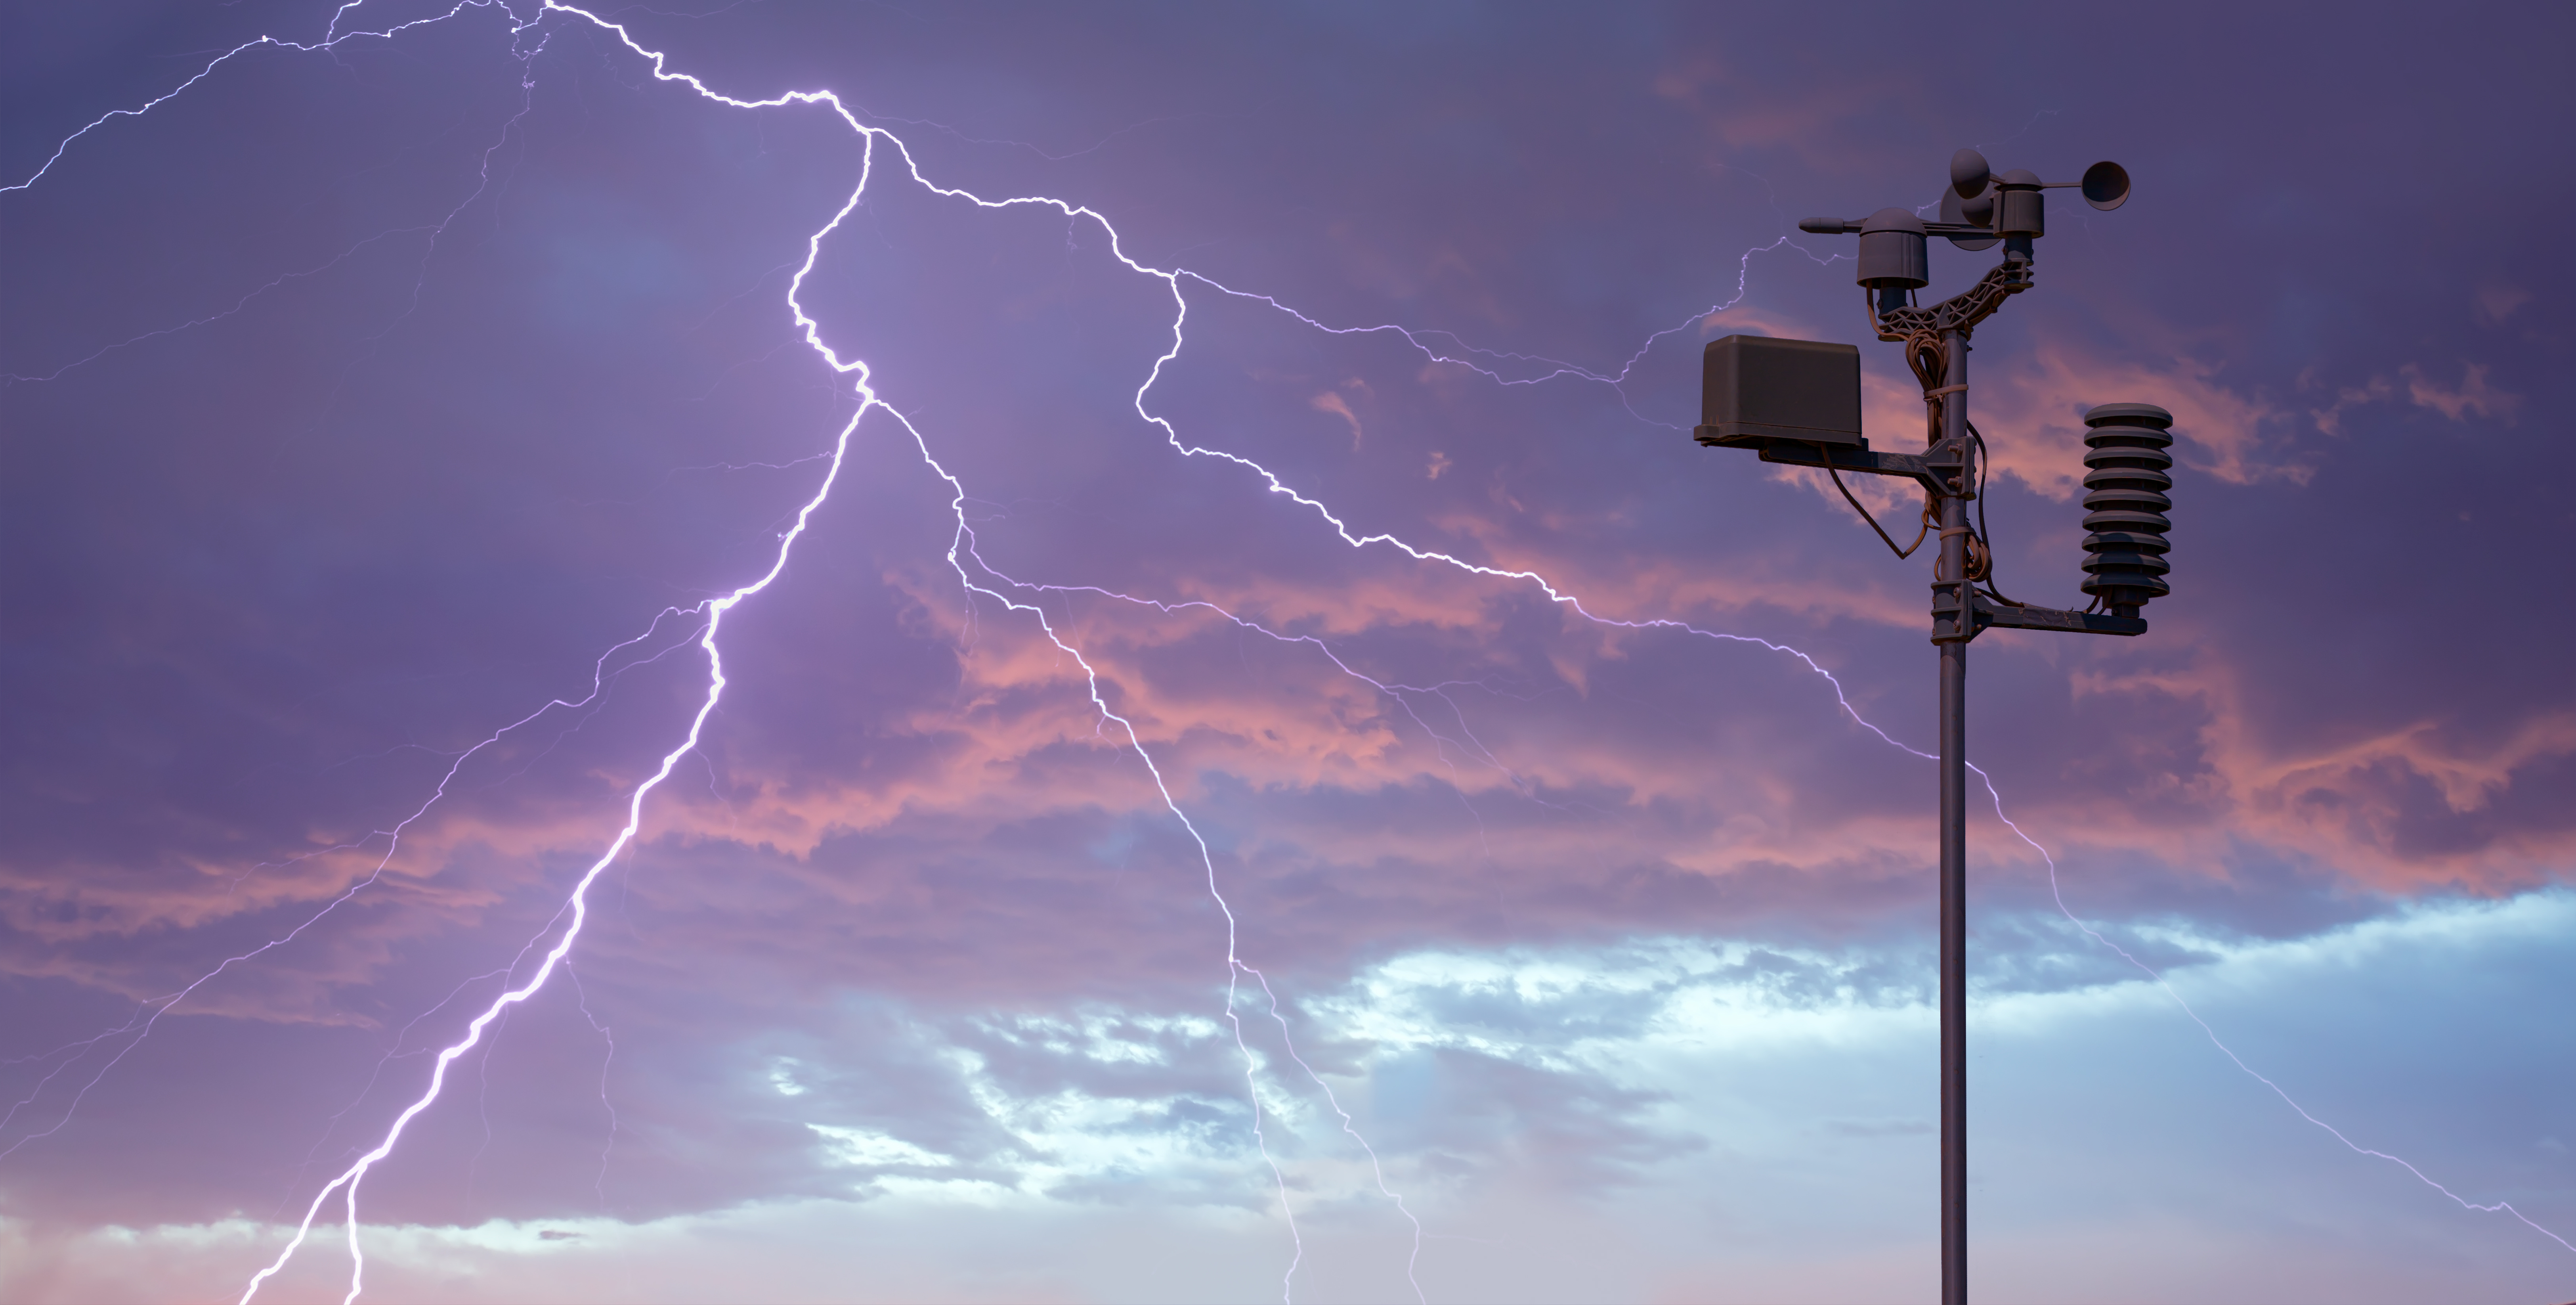
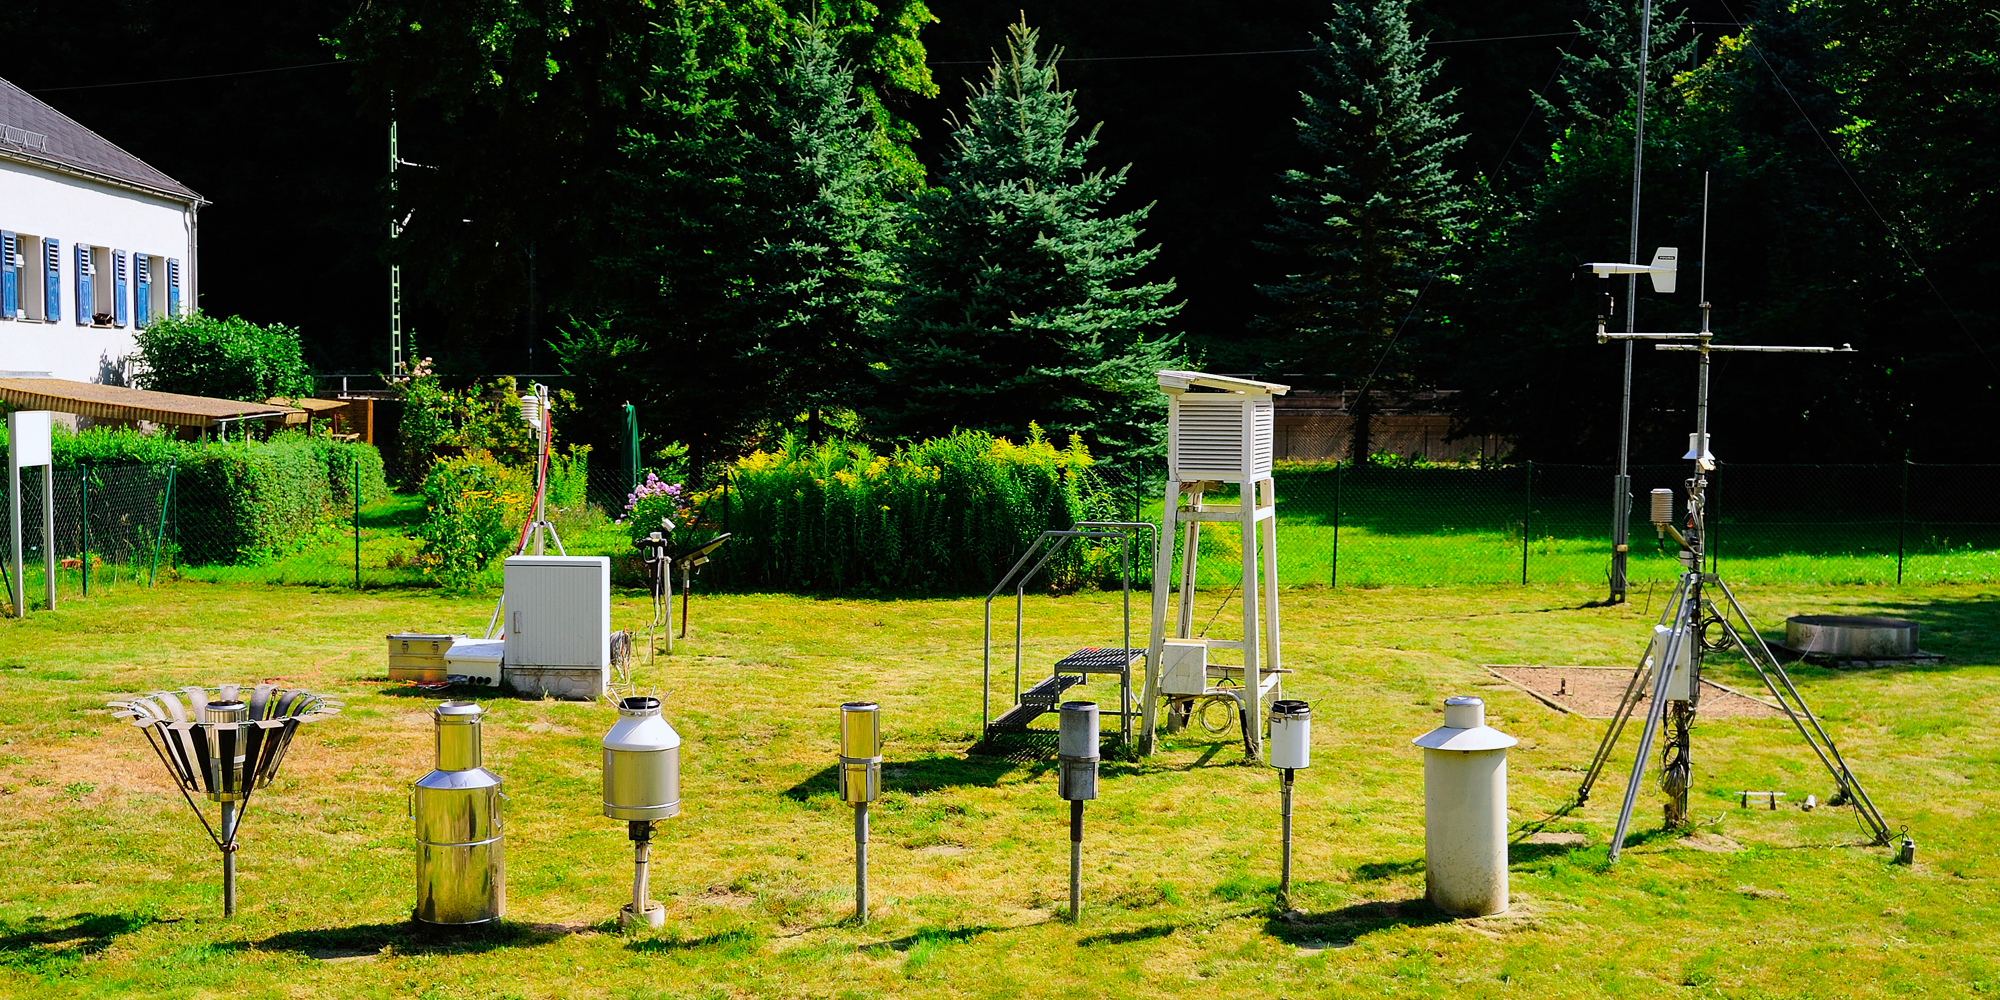
Weather observation begins with direct measurement, although no single observing system can describe the atmosphere on its own. Surface stations record temperature, pressure, precipitation and wind at specific locations; weather balloons sample the atmosphere vertically; ships and buoys extend coverage across the oceans; and radar and satellites provide information over much larger areas.
Each system captures a different part of the atmosphere. A thermometer measures temperature at one place and height, radar detects precipitation and its movement, while satellites derive information on clouds, temperature and moisture from measured radiation. meteoblue combines these sources with local measurements to describe current conditions and evaluate forecast performance, particularly where one observation type alone would leave important gaps.
Observations still need to be interpreted in context. A station represents a specific point and may not reflect conditions on a nearby slope, coastline or urban district, while observing networks are unevenly distributed and records may contain gaps or changes caused by instrument replacement. Radar and satellites extend coverage, but some variables are estimated indirectly, so their accuracy depends on the instrumentand atmospheric conditions.
Forecasts: estimating future conditions
Forecasting begins with an estimate of the atmosphere's current state and uses numerical weather prediction models to calculate how air movement, temperature, moisture and other variables may develop over the coming hours and days. This starting point is created through data assimilation, which combines observations with model information and also provides estimates for locations without direct measurements.
Forecasts are inherently uncertain because the atmosphere cannot be observed perfectly and models simplify complex processes such as clouds, turbulence and terrain effects. Small differences in the initial state can grow with time, which is why confidence generally decreases with lead time and why a single model run should not be treated as the only possible outcome.
Ensemble forecasts represent a range of plausible developments, while multi-model approaches compare different forecasting systems. meteoblue combines numerical model output with measurements and post-processing methods to refine forecasts for individual locations and applications.
For businesses, forecasts are most useful when decisions depend on future conditions, whether that means scheduling outdoor work, anticipating wind availability, preparing for rainfall or managing heat exposure. Once the forecast period has passed, observations provide the reference for verification. More about this processing is explained in our recent article on what happens after a model run.
Reanalysis: reconstructing past weather
Historical analysis presents a different challenge because complete measurement records are not available everywhere. A location may never have had a weather station, existing records may contain gaps, and even a high-quality station describes only one point rather than the full atmosphere.
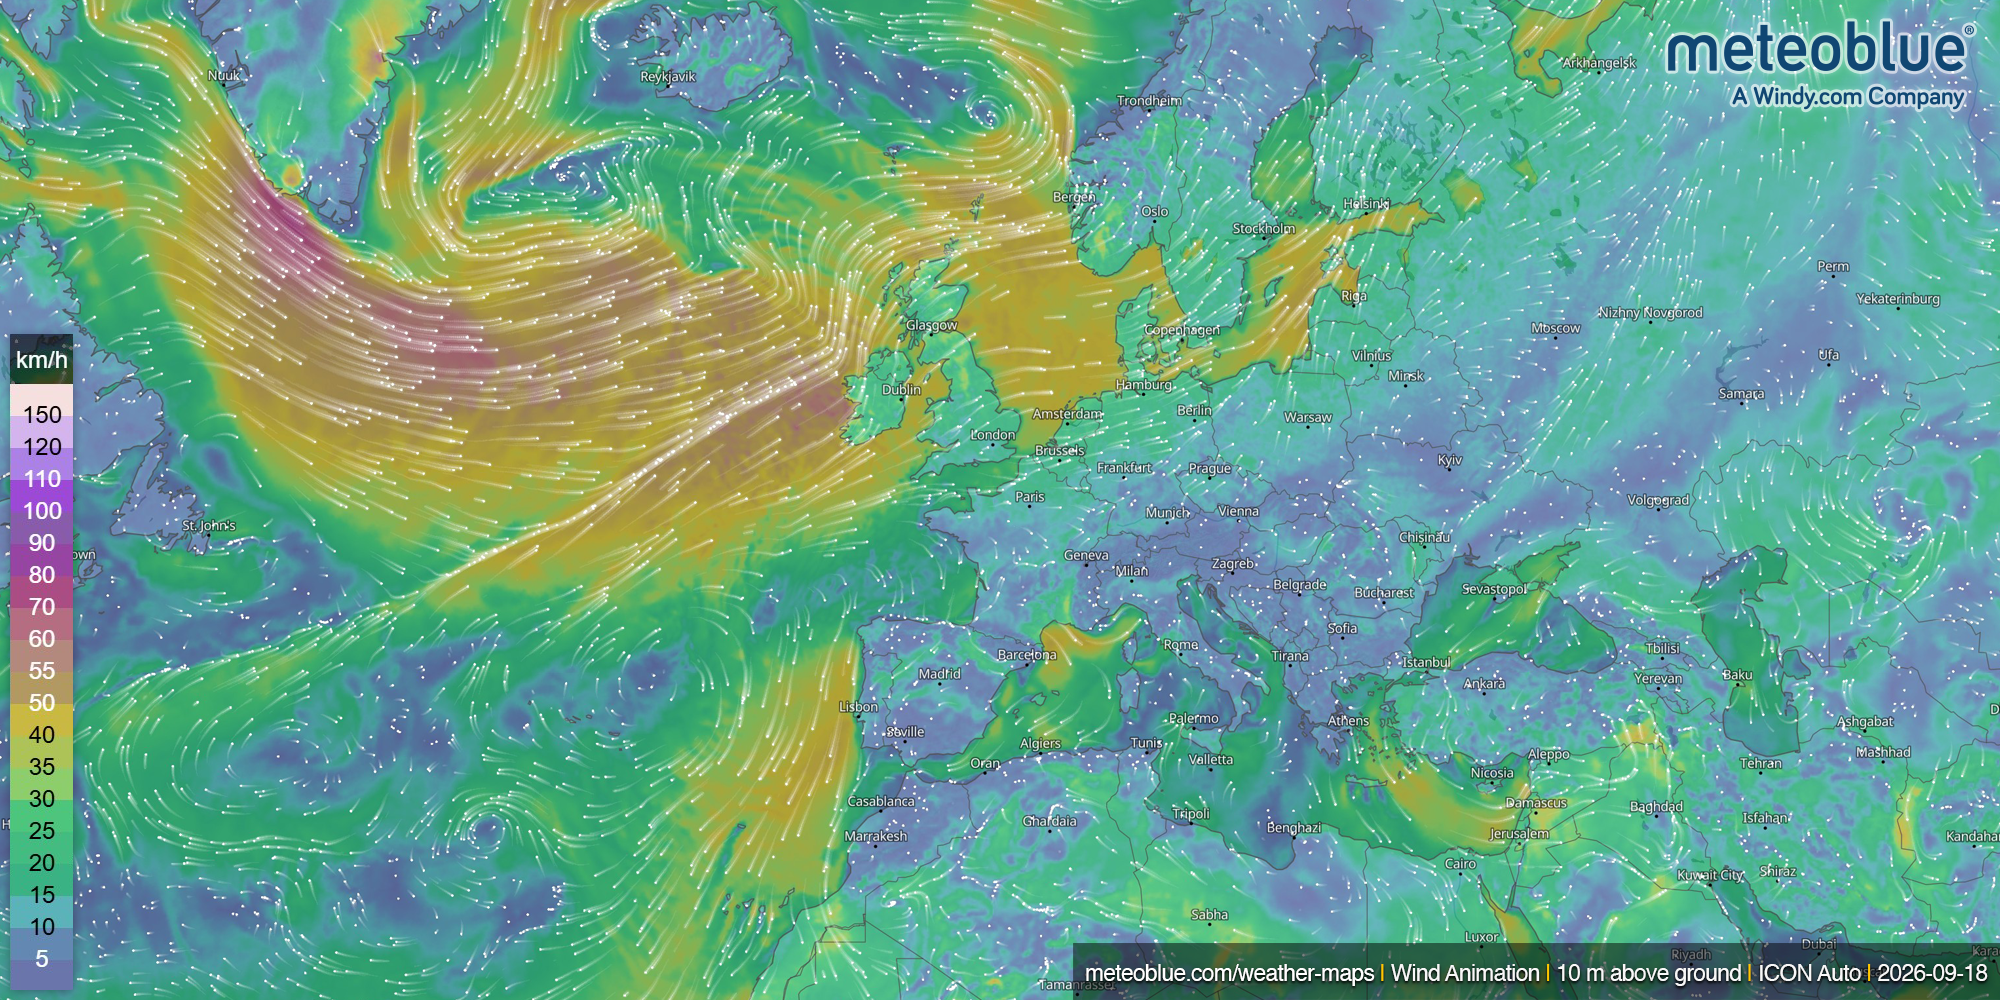
Reanalysis addresses this problem by combining historical observations with model calculations to reconstruct past conditions across a continuous spatial grid, including locations where no direct measurements were made. Because the same modelling framework is applied throughout the period, conditions from different years can be compared more consistently.
One widely used example is the ECMWF ERA5 reanalysis produced for the Copernicus Climate Change Service (C3S), which provides hourly information from 1940 onwards for a broad range of atmospheric and surface variables. Reanalysis is not a measurement archive: many values are model-based estimates constrained by available observations, and the system can incorporate data that became available only after the original forecast was issued.
This consistency makes reanalysis valuable for long-term studies and sectoral assessments, especially where complete station records do not exist. Its quality still depends on the historical observing network and model resolution, so small thunderstorms, local gusts and fine-scale terrain effects may be less well represented. meteoblue provides reanalysis information alongside other historical simulation datasets so that users can select the source that best fits their application.
Climatology: defining long-term reference conditions
While historical weather data describes particular periods or events, climatology provides the statistical context needed to understand what is typical for a location and time of year. A temperature of 30 °C may be routine in one region and exceptional in another, and that distinction only becomes meaningful when the value is compared with a sufficiently long local record.
Climatologies summarise those records through statistics such as average temperature, precipitation totals, wind distributions or the frequency of frost and hot days. They may be calculated from observations or model-based datasets and provide a useful reference for comparing individual events, seasons or operating conditions.
The reference period matters because the meaning of 'normal' depends on the selected baseline. The World Meteorological Organization (WMO) defines standard climatological normals using 30-year periods, with 1991-2020 as the current standard period, while 1961-1990 is retained as a fixed reference for long-term climate-change assessments.
Historical baselines are also used for climate projections, which estimate how temperature, precipitation and extremes may change over coming decades under different greenhouse-gas emission scenarios. Comparing projections with an established baseline helps show how future conditions may differ from those considered typical today.
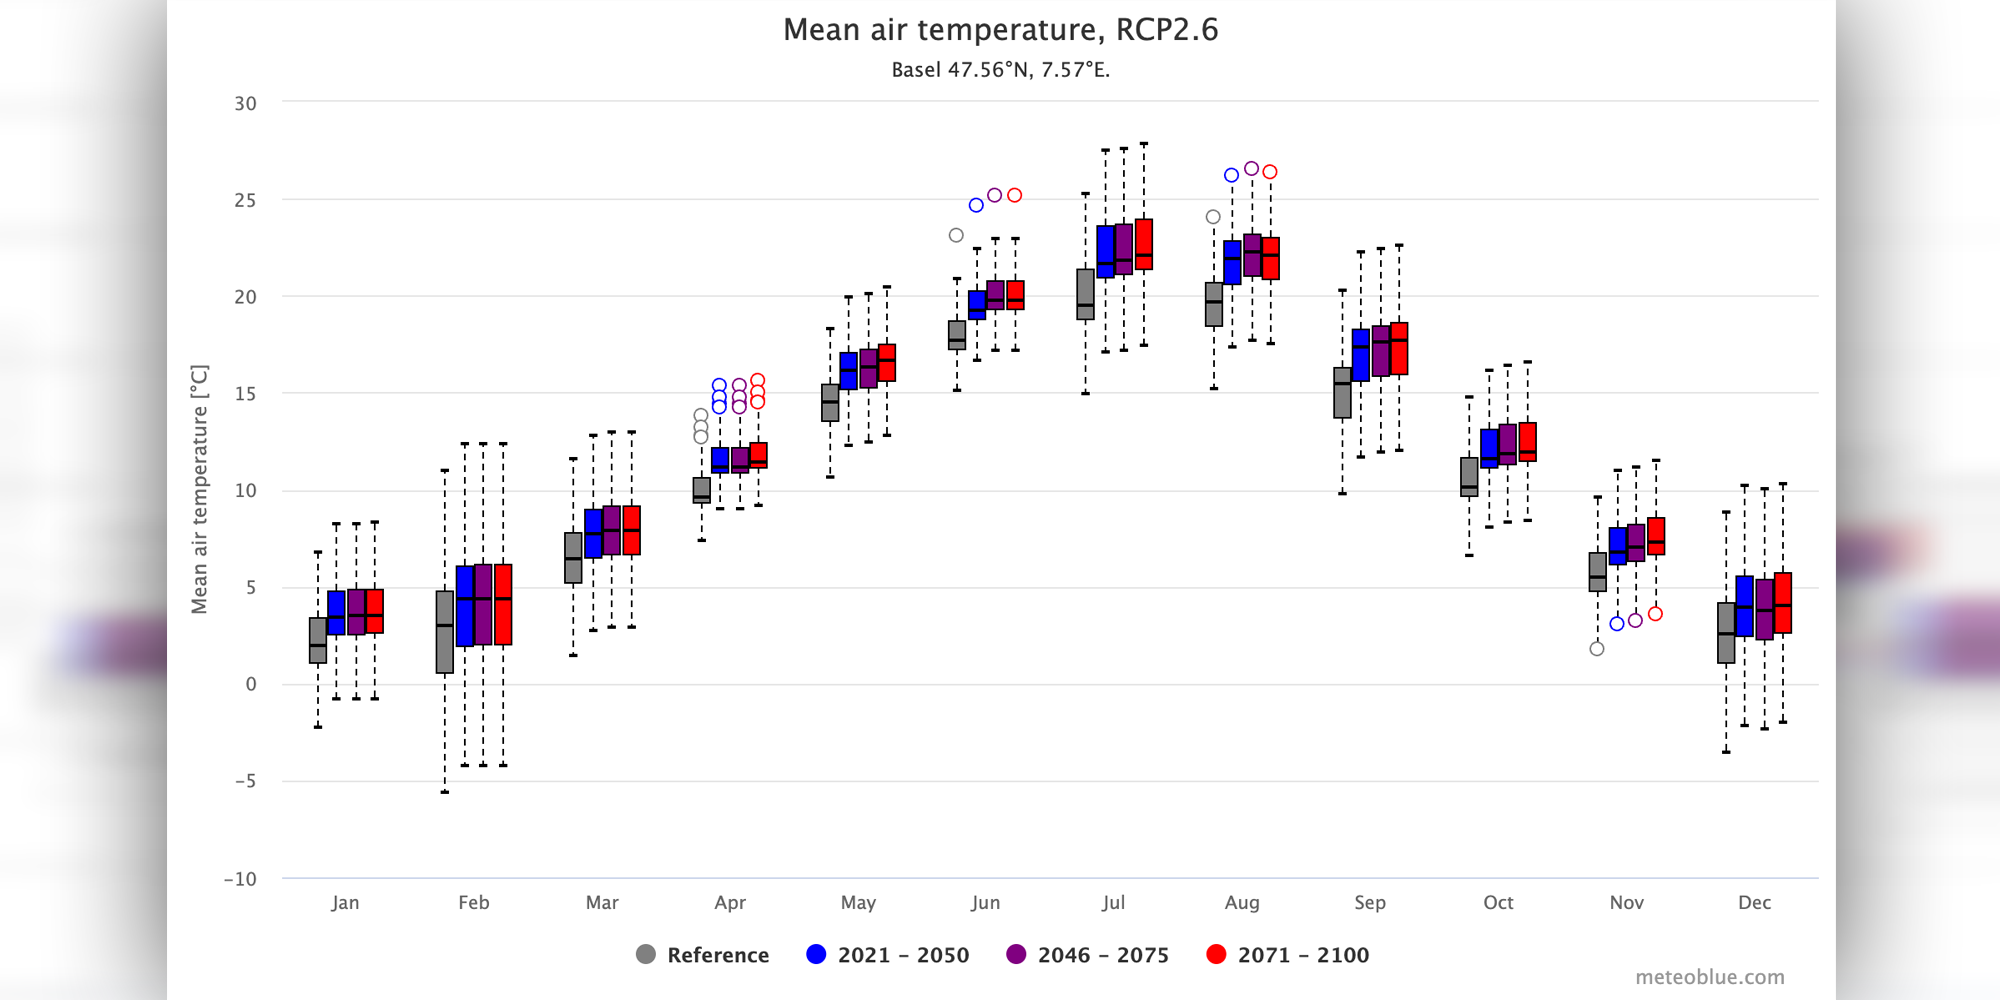
One location, four different data types
At a single operating site, a sensor reading of 18.4 °C at 08:00 is an observation, a value of 20 °C expected tomorrow afternoon is a forecast, an hourly temperature series reconstructed for summer 1995 may come from reanalysis, and the typical September maximum temperature is climatological information. The unit may be identical in all four cases, but the meaning of each value is different.
A reanalysis value should not be interpreted as proof that a thermometer recorded exactly that temperature at the site, just as a climatological average cannot predict conditions on a particular afternoon. The source also determines the level of detail that can reasonably be expected: stations provide highly local information, gridded datasets offer wider coverage while simplifying conditions within each cell, and forecasts describe the future with unavoidable uncertainty.
Different sources, complementary value
In practice, these data categories form an interconnected information chain. Observations describe the current atmosphere and provide the reference for forecast verification, historical observations contribute to reanalysis, and long records from observations, reanalyses or simulations provide the basis for climatologies and longer-term comparisons.
For historical weather analysis, the meteoblue Dataset API provides access to archived datasets with selectable variables, time periods and geographic areas, allowing the data source to be matched more closely to the requirements of a particular study or operational workflow.
Understanding how a dataset was produced is essential when comparing sources or applying them to operational and strategic decisions. Observations, forecasts, reanalysis and climate normals are all valuable when used in the right context.