Measurements API
La Measurement API di meteoblue offre accesso a misurazioni meteorologiche ad alta risoluzione provenienti da reti globali di stazioni, consentendo analisi, modellazione e monitoraggio affidabili grazie a formati flessibili e potenti opzioni di filtraggio.

Accedete ai dati di misurazione di stazioni in tutto il mondo
Hourly temperature observations from weather stations worldwide, as shown on the Measured Temperature map at meteoblue.com.
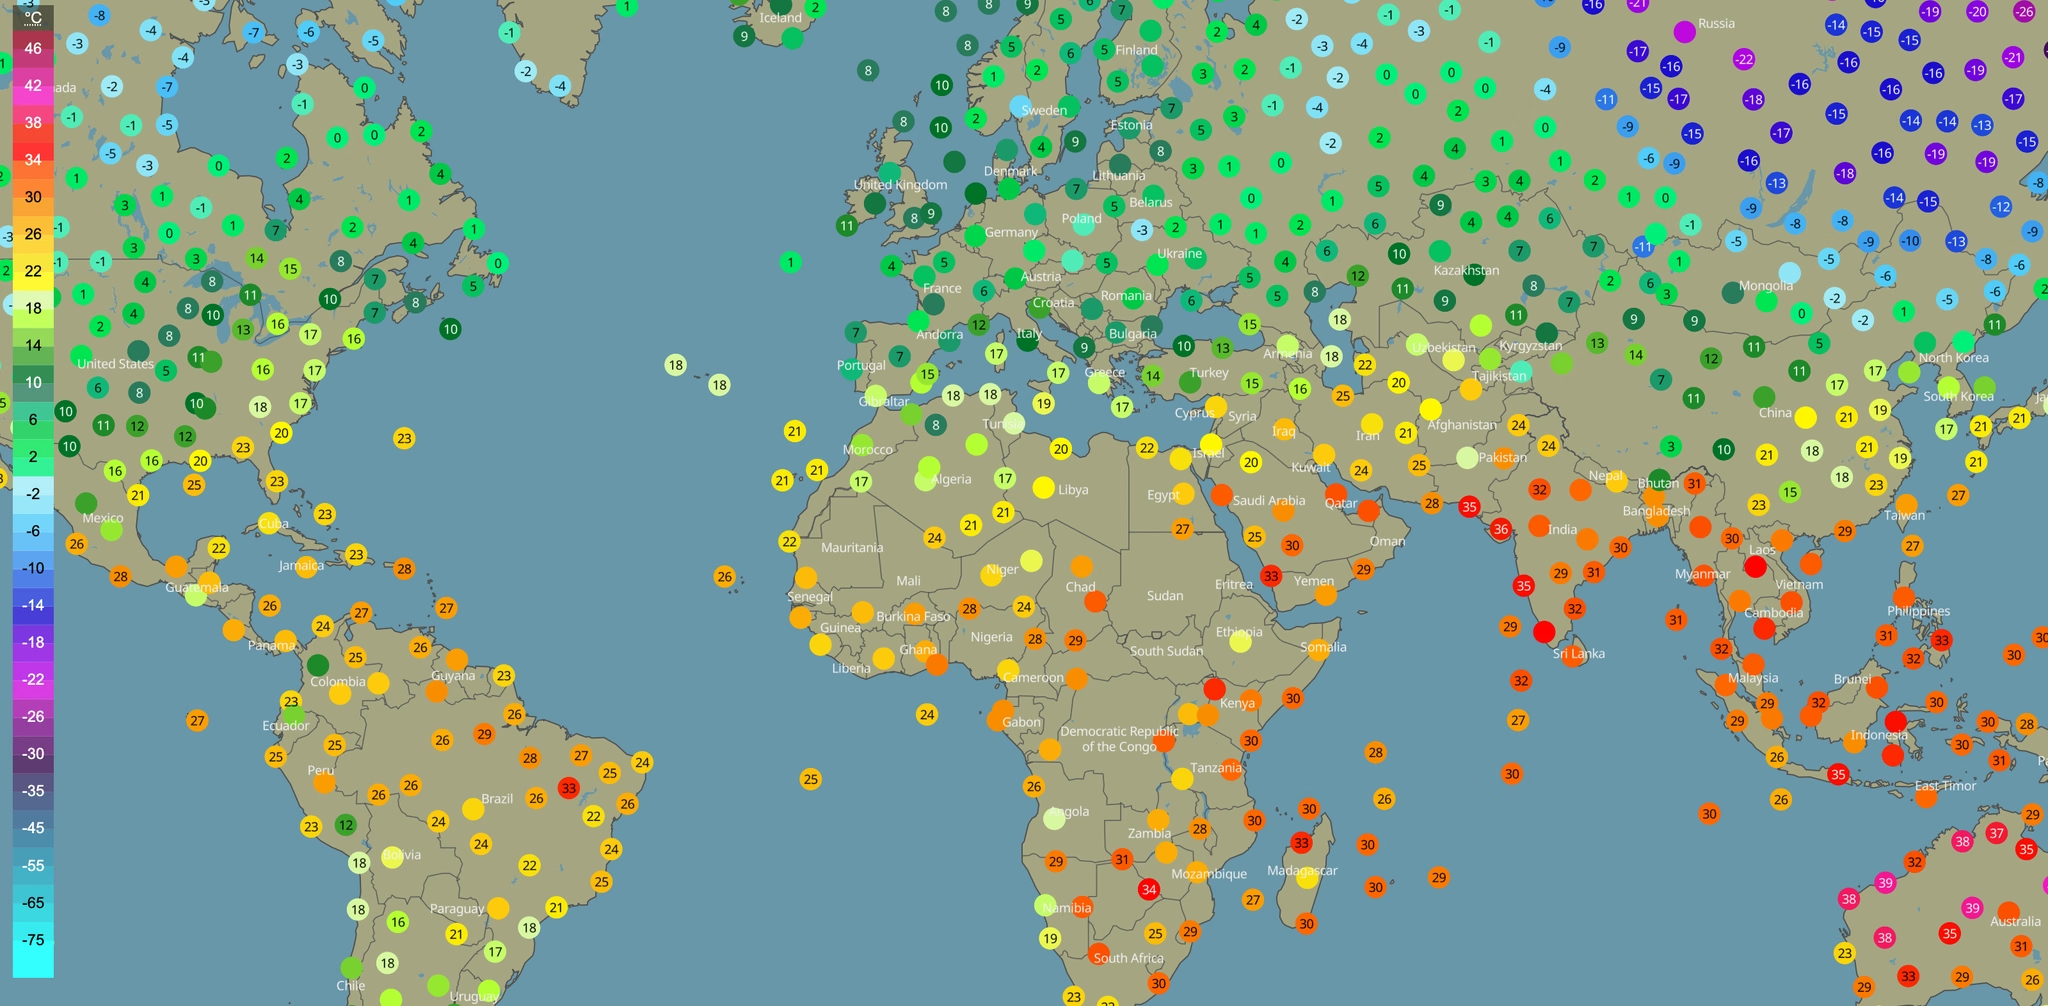
34.000+
Stazioni meteorologiche con controllo di qualità (2025)
28.000+
Stazioni con serie coerenti di temperatura dell'aria su 10 anni
Un’API robusta per applicazioni più esigenti
Filtri avanzati e query di localizzazione
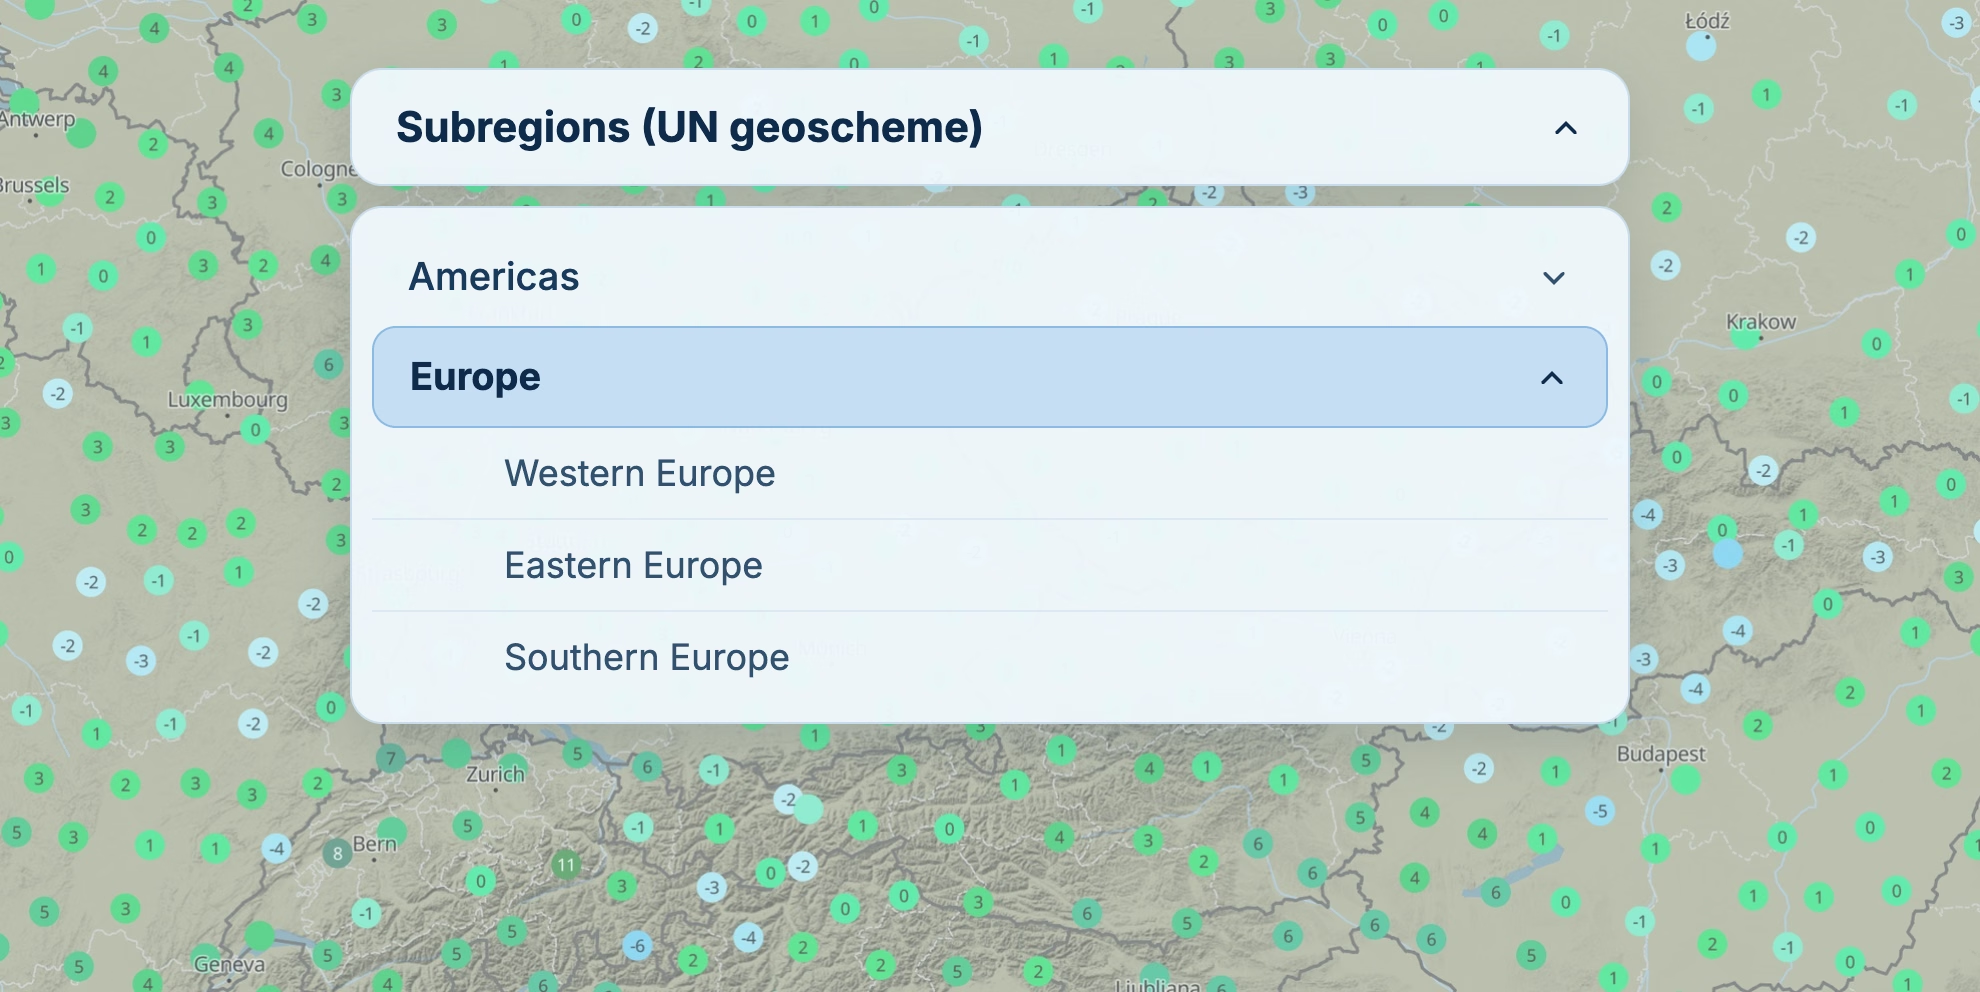
Individuate esattamente i dati di cui avete bisogno grazie a query potenti e flessibili. Filtrate i dati per stazioni specifiche, aree geografiche (riquadri di latitudine e longitudine) o confini amministrativi. Potete inoltre individuare istantaneamente la stazione di misurazione geograficamente più vicina a qualsiasi coordinata.
Copertura globale e accesso completo ai metadati
Accedete a misurazioni in tempo reale e storiche provenienti da una rete globale di fornitori affidabili, come NOAA e DWD. L’API consente di recuperare metadati completi delle stazioni, selezionare le stazioni in base alla copertura dei dati e alla continuità delle serie temporali, nonché accedere a serie temporali meteorologiche per stazioni specifiche o aree geografiche.
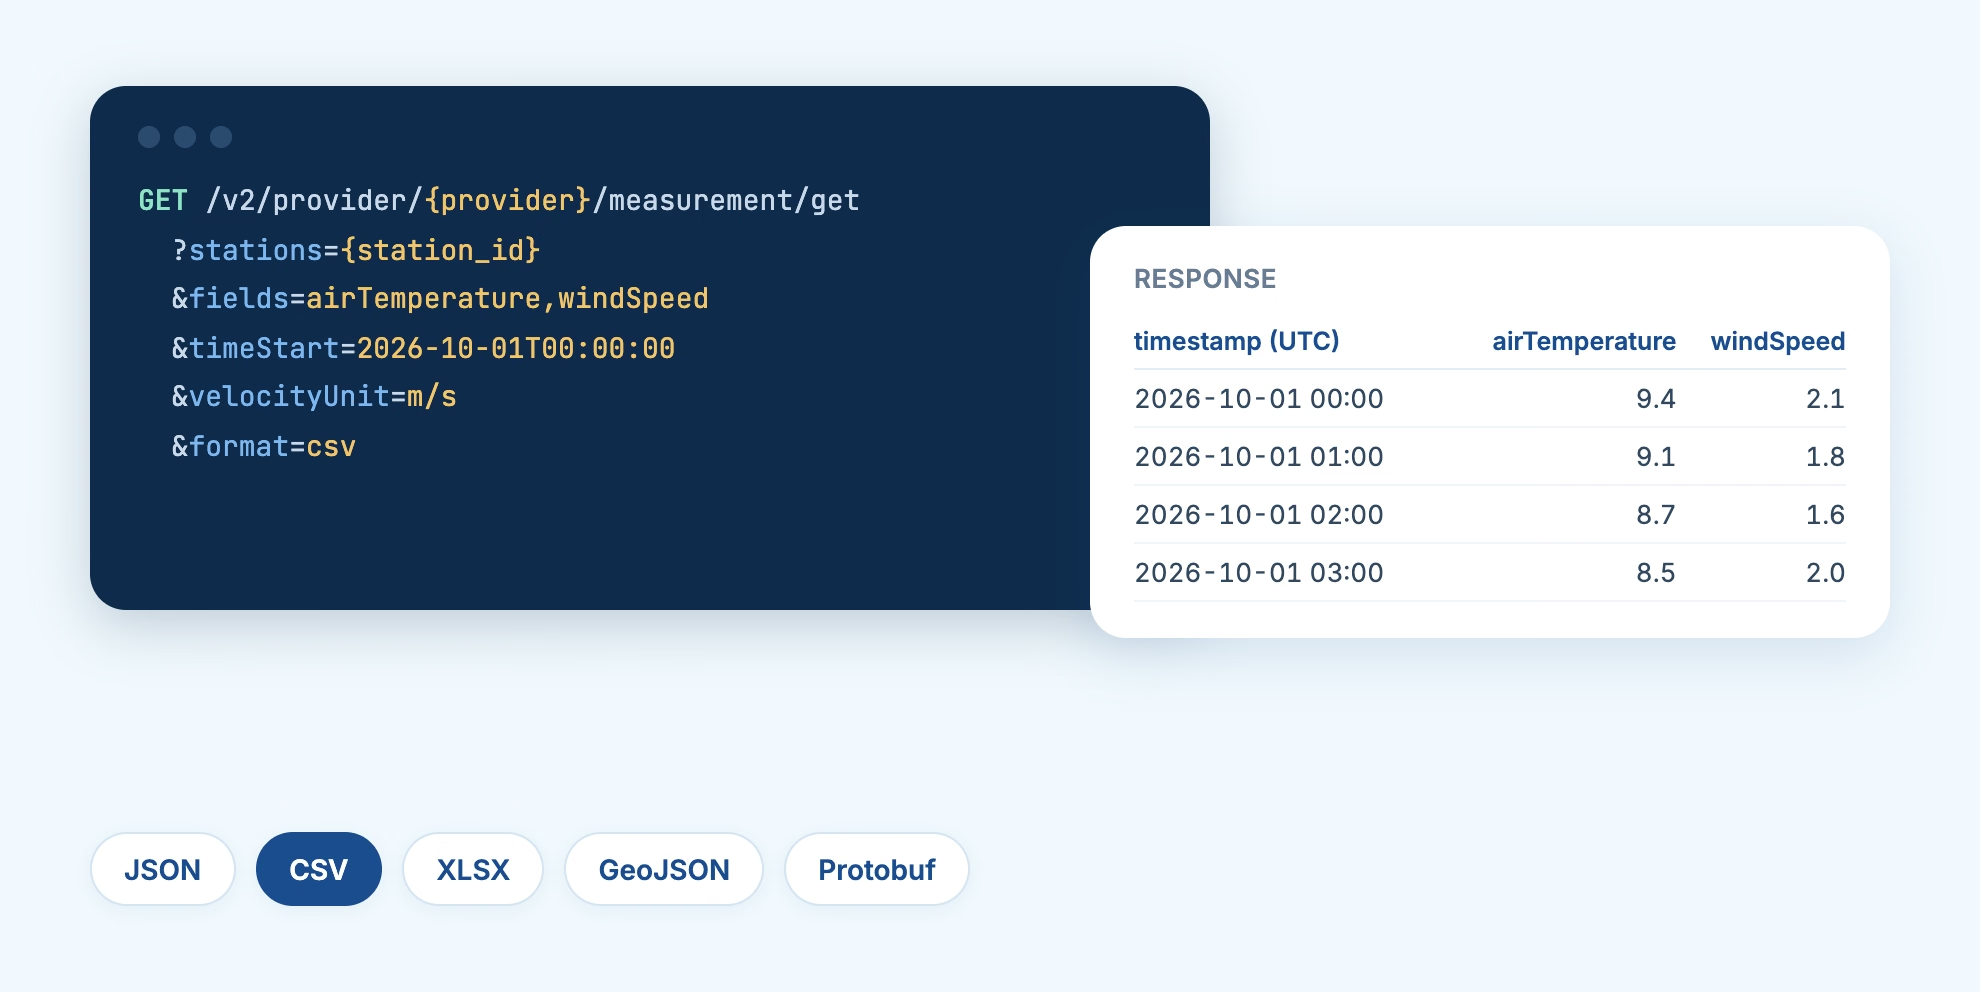
Integrazione semplificata e output in più formati
Integrate più rapidamente i dati delle stazioni meteorologiche grazie a un’esperienza di sviluppo migliorata. L’API utilizza nomi delle variabili semplici e intuitivi e fornisce i dati in diversi formati: JSON, CSV, XLSX, GeoJSON e Protobuf.
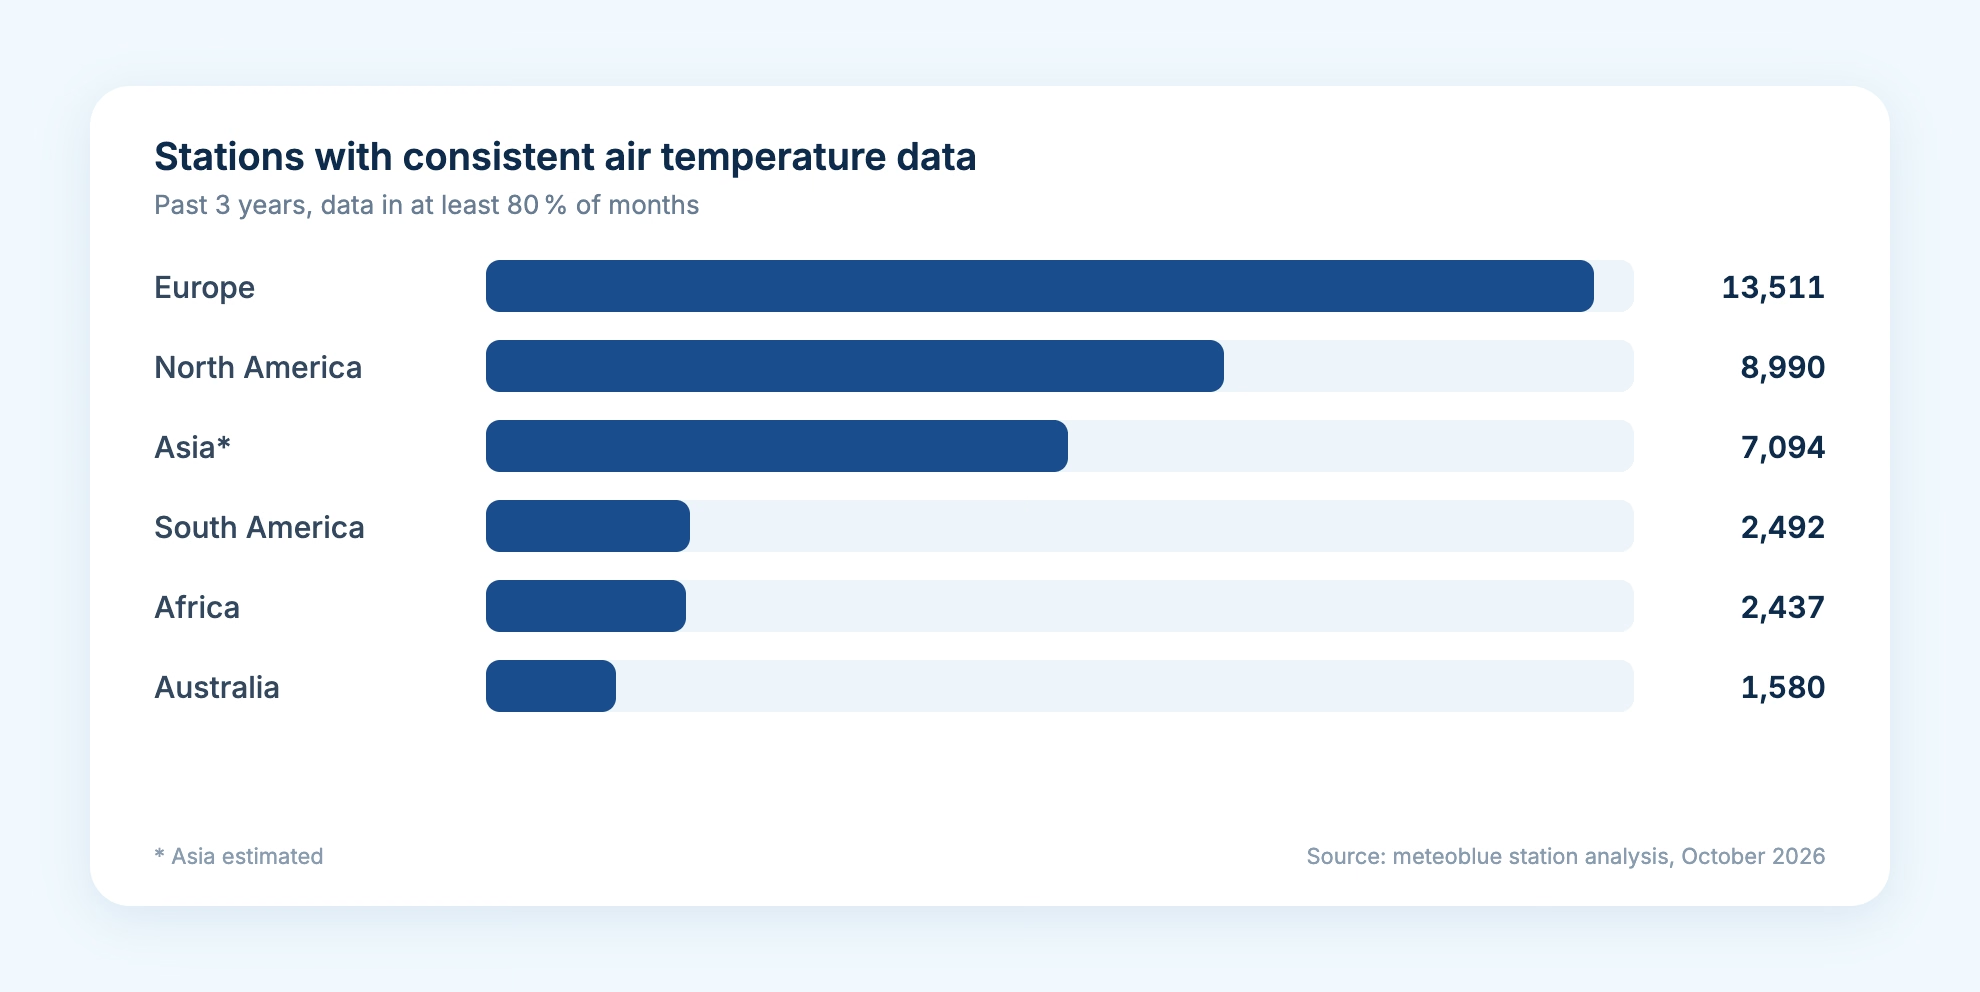
Station Coverage, Analysed Region by Region
We analyse how many stations report per country and continent, for how long and how completely. Over the past three years, more than 13,500 stations in Europe delivered consistent air temperature data. Factsheets for key countries are available from our sales team.
How Quality Control Works
Every value on the quality-controlled routes passes four stages of the meteoblue QC system. If a station does not meet the criteria, aggregated QC values from nearby stations may be returned instead.
1
Sanity Checks
Physically impossible values are rejected first.
2
Climatological Checks
Each value is compared with the long-term range expected at that location.
3
Spatial Consistency
Readings are checked against nearby stations and model data.
4
Extended meteoblue QC
Proprietary checks developed by meteoblue run on top.
What Station Data Are Used For
Measured values are the independent reference behind forecasts, models and operational decisions.
Forecast Verification
Compare forecasts and model output with what stations actually measured, location by location and hour by hour.
Energy Asset Monitoring
Check temperature, wind and radiation at solar and wind sites against independent observations nearby.
Sensor Network Enrichment
Add public and partner stations around your own sensors to close coverage gaps and cross-check readings.
Model Training and Research
Use quality-controlled time series as ground truth for statistical and machine-learning models.
Agriculture Decision Support
Feed observed rainfall, temperature and humidity into irrigation, disease and field-work models.
Urban and Transport Monitoring
Follow current conditions across a city or along a road network from one API.
Solar-Log si affida da molti anni a meteoblue per realizzare previsioni accurate della produzione fotovoltaica grazie ai suoi modelli proprietari di simulazione meteorologica. Utilizziamo i dati meteoblue per analisi di siti, previsioni della produzione solare specifiche per sito e area, nonché servizi dedicati al trading energetico.

Storie di successo

Case Study: How NHW Uses Climate Risk Analysis to Prepare Its Housing Portfolio
NHW worked with meteoblue and Sustainable AG to assess heat and flood risk at 13 locations in the Frankfurt area. The analysis helps show where climate exposure may increase and where adaptation measures could be prioritised.

Case Study: High-Resolution Climate Modelling for the Swiss Rail Network
meteoblue provided SBB and Allianz Fahrweg with high-resolution climate data and long-term projections to reassess neutralisation temperature standards across Switzerland's rail network.
meteoblue and KPMG Norway Partner to Deliver Climate Risk Assessments
meteoblue and KPMG Norway have formed a strategic partnership to deliver site-specific climate hazard, exposure and vulnerability data for Norwegian companies.
Syngenta Crop Protection
Syngenta is a leading science-based agtech company, helping millions of farmers around the world to grow safe and nutritious food, while taking care of the planet.

Our Partnership with Microsoft Flight Simulator
Our Partnership with Microsoft Flight Simulator
Solar-Log and meteoblue: A Partnership Shining Bright for a Sustainable Future
VitiMeteo - Prognostic system for crop protection in viticulture.
A disease forecasting system for winegrowers. meteoblue has supplied the underlying weather forecasts since 2009, including leaf wetness, a variable critical for predicting fungal infection and unavailable from other providers at the time.

Air Navigation - Air Navigation Pro and meteoblue: A Soaring Partnership in Aviation
A detailed look at how weather influences agricultural practices.
Weathering the storm: The partnership between MarineTraffic and meteoblue
An informative guide on hurricanes and their effects.
WaterApp - When water becomes scarce
A comprehensive overview of the techniques used in weather forecasting.

How to build a network of weather stations in Africa - TAHMO
A detailed analysis of how climate change is altering weather patterns.
Settori con cui collaboriamo

Energia
Ottimizzate la produzione di energia rinnovabile e proteggete le infrastrutture critiche grazie a previsioni precise che riducono il rischio di guasti e massimizzano le prestazioni dei vostri asset energetici.

Agricoltura
Prendete decisioni agricole più efficaci grazie a un’intelligenza meteorologica che protegge le colture, ottimizza le operazioni in campo e massimizza le rese riducendo al tempo stesso gli sprechi di risorse.

Trasporti & Logistica
Garantite operazioni di trasporto più sicure ed efficienti prevedendo le condizioni stradali, ottimizzando i percorsi rispetto ai rischi meteorologici e riducendo i ritardi causati dal maltempo.

Resilienza urbana
Costruite città pronte per il clima di domani progettando infrastrutture in grado di resistere alle condizioni future e proteggendo i sistemi critici dagli eventi meteorologici estremi.

Tempo libero
Offrite esperienze eccezionali ai visitatori pianificando eventi con maggiore sicurezza, garantendo la sicurezza degli ospiti e ottimizzando le operazioni grazie a previsioni meteorologiche accurate.

Scoprite le nostre opzioni di prezzo
Piani tariffari flessibili pensati per organizzazioni di ogni dimensione, dalle startup alle grandi imprese. Scoprite la soluzione più adatta alle vostre esigenze.

Frequently Asked Questions
La Measurements API di meteoblue fornisce osservazioni meteorologiche reali da una rete globale di stazioni al suolo, ovvero la «ground truth» misurata alla base del meteo. Offre misurazioni in tempo reale e storiche da stazioni di tutto il mondo, tra cui oltre 34.000 stazioni con controllo di qualità, con filtri flessibili e diversi formati di output. Così potete validare le previsioni, monitorare le condizioni e alimentare i vostri modelli con dati affidabili.
The Measurements API provides real-time and historical measurements recorded at physical weather stations, such as temperature, humidity, wind speed, and pressure. You retrieve the data as time series for individual stations or for a whole geographic area, and each provider's exact set of available parameters can be discovered before you request data. Because the values come from instruments on the ground, they serve as an independent reference for forecasts and models.
The Measurements API lets you target exactly the data you need. Query one or more stations by ID, or select every station in an area with a latitude/longitude bounding box or a GeoNames polygon, such as a country or region. You can also find the nearest station to any coordinate, choose which fields to return, request only the latest values, and set a UTC time range, with pagination for large exports.
Quality-controlled data pass the meteoblue QC system in four stages: sanity checks against physically impossible values, climatological checks against long-term expected ranges, spatial consistency checks against nearby stations or model data, and extended proprietary checks developed by meteoblue. QC data are not available for every station and period. If a station does not meet the QC criteria, aggregated QC values from nearby stations may be returned instead.
Where a station did not report a value, gap filling replaces the missing hours with the value of a weather model for the same location and time, for example ERA5T. Gap filling is required for daily, monthly or yearly aggregates. A gap-filled series therefore mixes measured values with model data, which matters if you need pure observations.
Use raw data when you need every variable a network measures at its native time resolution, or when you run your own checks. Use quality-controlled data when you need validated hourly values ready for analysis, forecast verification or model training. QC data cover air temperature, dew point, relative humidity, wind speed, precipitation and total cloud cover, and cost more credits per value than raw data.
Access is authenticated with a meteoblue API key, and usage is billed in credits. Lightweight calls such as listing providers, reading station metadata, and nearest-station lookups cost a small fixed number of credits, while measurement values are charged per value, with quality-controlled data costing more than raw.