Maps API
Integrate high-resolution, interactive weather maps into your applications with access to multiple weather models optimised for different regions and use cases.

Integrate Maps That Match Your Brand and Business Logic
30+
Weather models provide a unique range of data
3,000+
Business customers from more than 100 countries around the globe
250,000+
Weather stations enable world’s highest precision
Set Up Interactive, High-Resolution Weather Map Displays Within Minutes
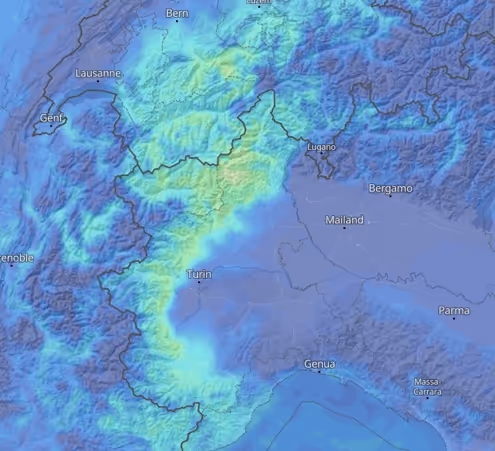
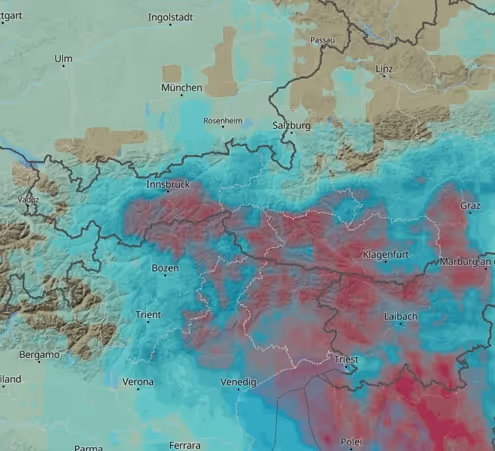
40+ High-Resolution Weather Map Layers
Visualise key weather variables such as wind, precipitation, temperature, radar, and pressure using tile-based maps or a ready-to-integrate plugin, with multiple weather models, altitude levels, and forecasts extending several days ahead in mostly hourly time steps.
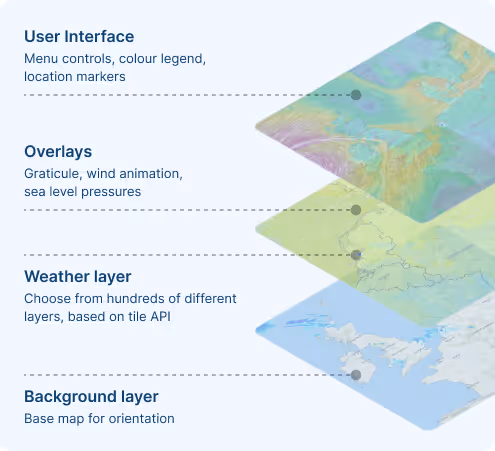
Easy Integration with Mapbox GL JS
Integrate the Maps API as a standalone solution with a simple script tag, or enhance an existing Mapbox map by adding weather overlays, layer selection, time sliders, and legends.
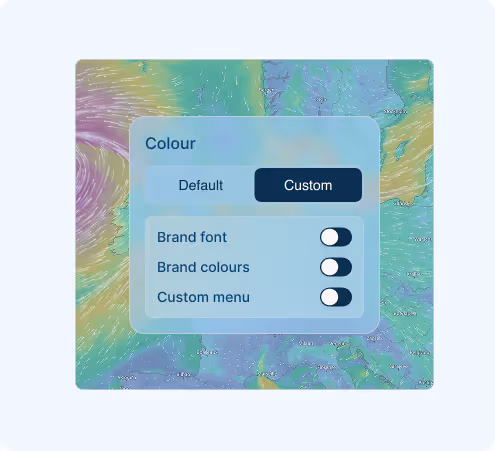
Flexible, Fully Customisable UI
Use the default interface, apply your own styling, or build a fully customised UI using the Mapbox GL JS framework and meteoblue underlying low-level Tile API for fully customised solutions.
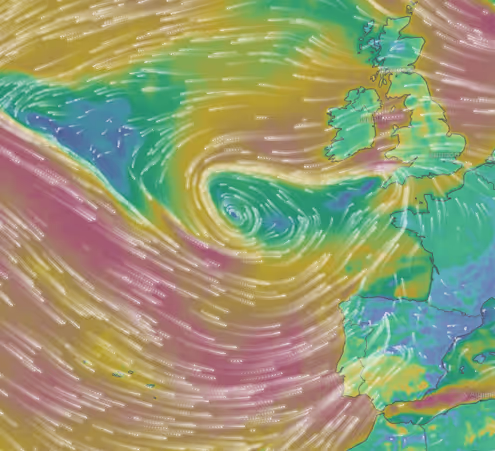
Real-Time Radar & Satellite Animations
Display engaging, fast-loading visualisations of live radar and satellite composite data, including short-term radar forecasts up to two hours ahead. Minute-by-minute animations are available via the plugin, while tile-based integrations allow custom animation on the client side.
MeteoArena chose meteoblue as a weather data provider because of the unparalleled offer of weather data. It is available worldwide, and offers insights into the past, present, and future weather conditions.

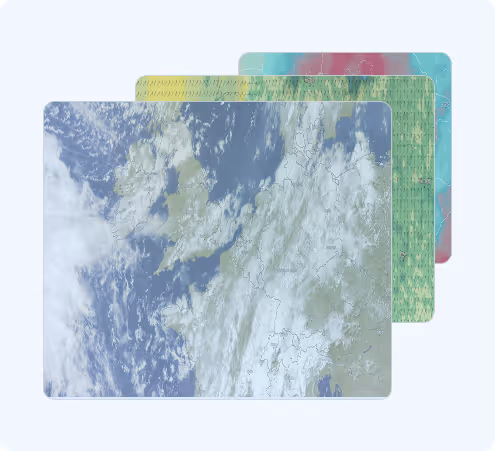
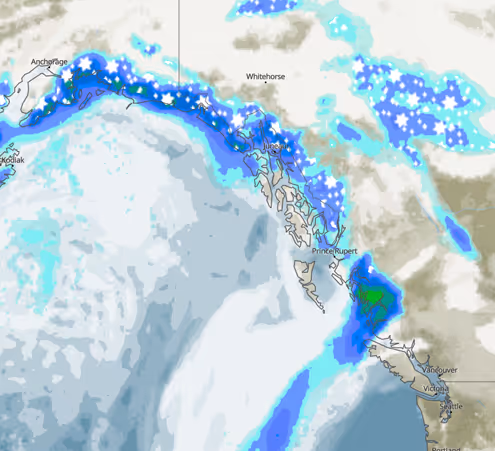
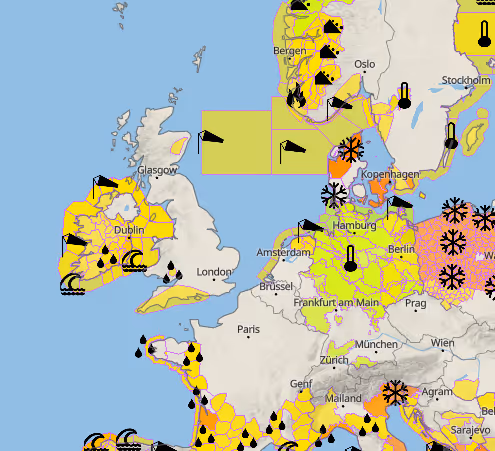
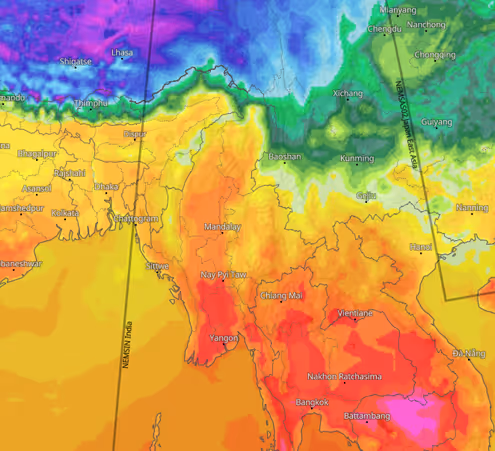
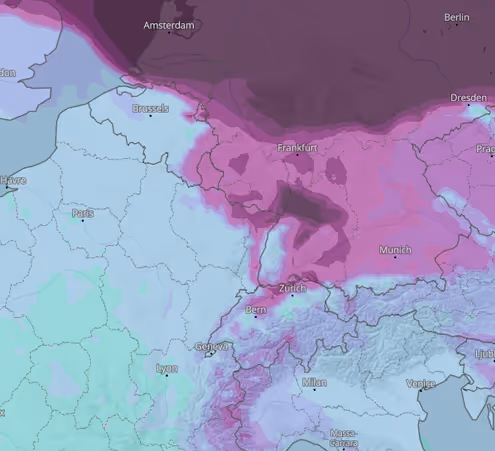
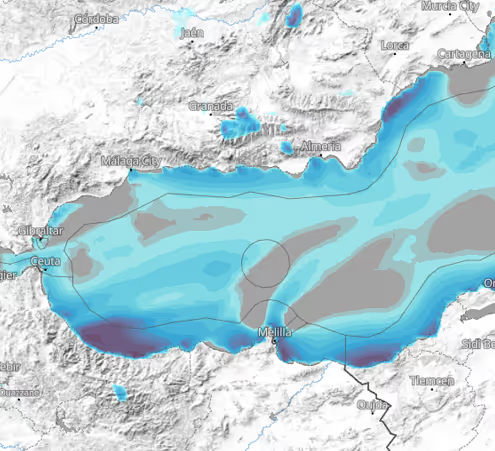
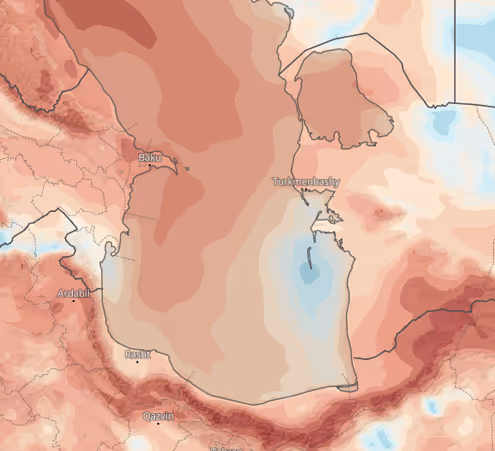
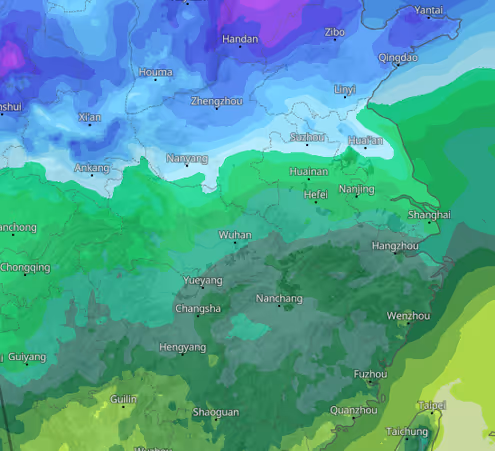
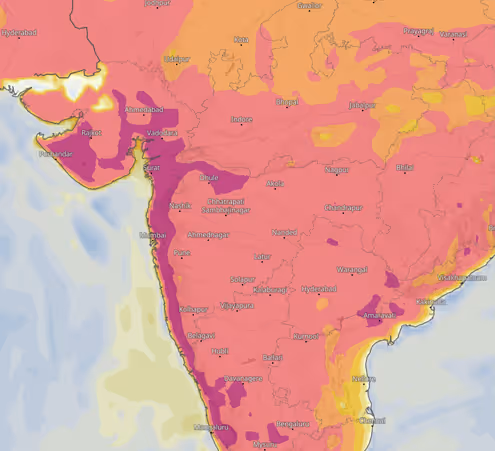
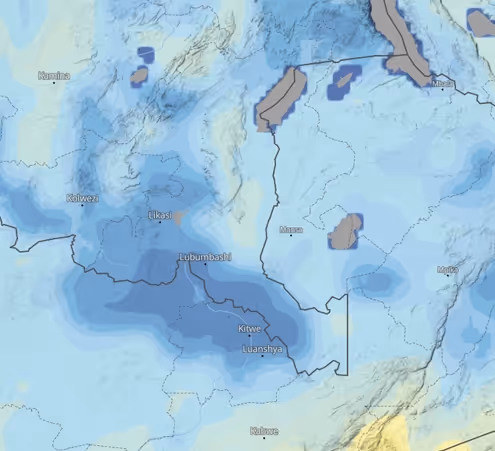
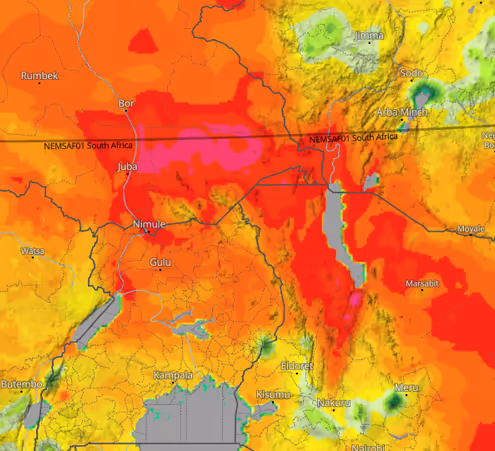
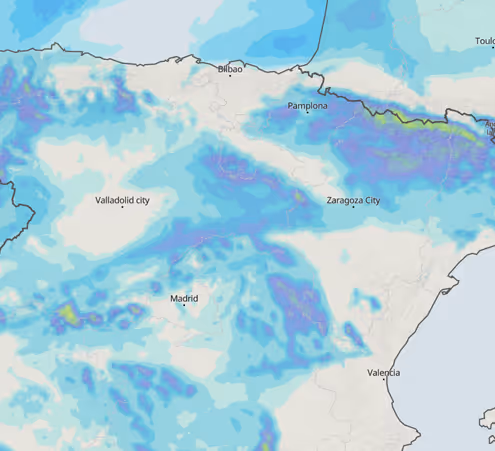
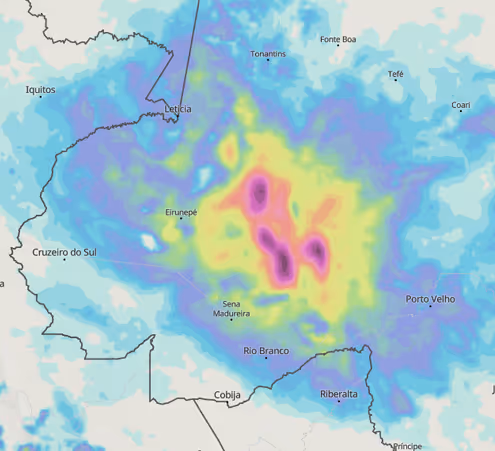
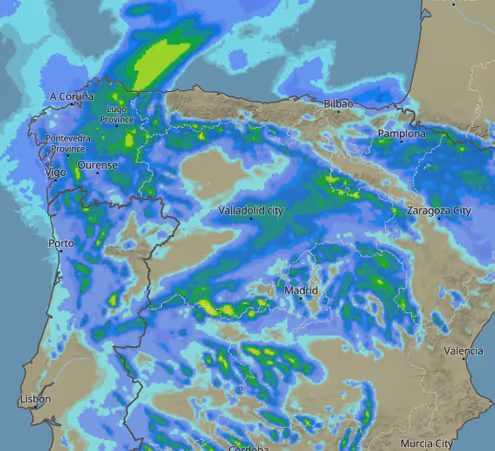
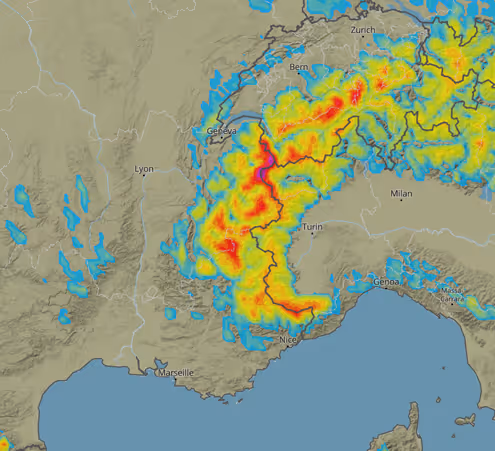
Visualise the Weather That Impacts You
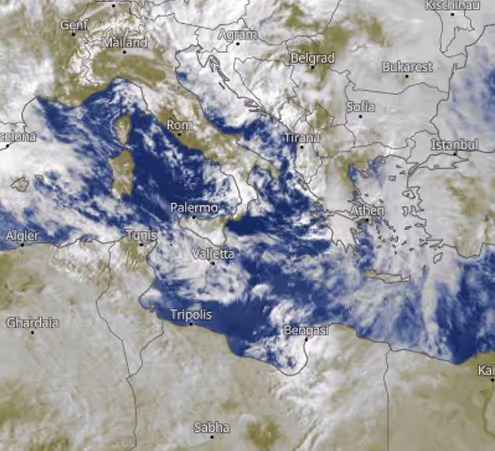
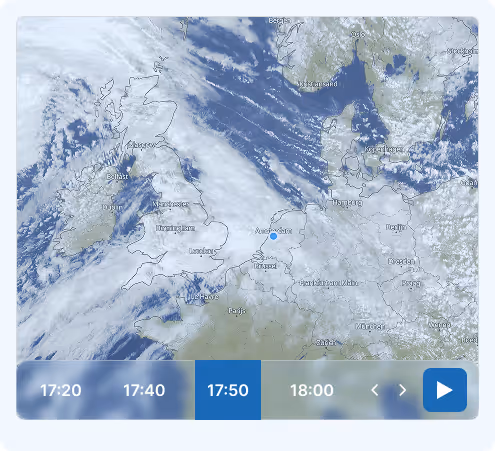
Satellite
Latest satellite imagery showing clouds and weather systems with historical maps available to 2019.
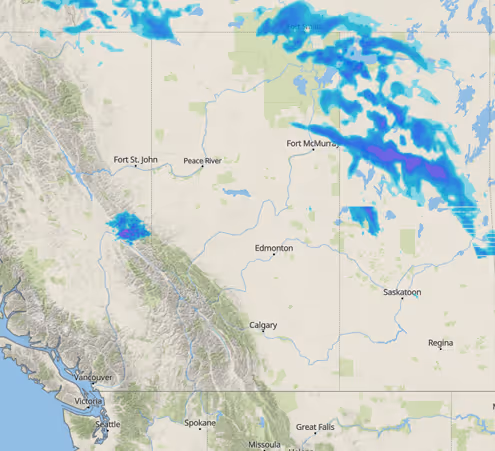
Weather Radar
Radar-based precipitation intensity and movement with global composite coverage, minutely intervals, and a 2-hour nowcast animation.
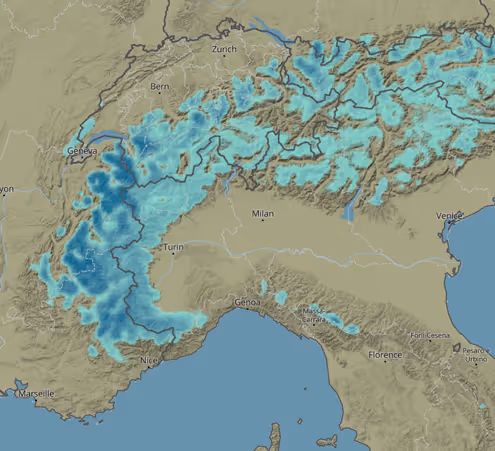
Clouds & Precipitation
Combined view of cloud cover and precipitation areas.
Sunshine Hours
Expected duration of sunshine over a given period.
Freezing Level Height
Altitude where air temperature reaches 0°C.
Temperature Change (Next 24h)
Forecasted temperature difference over 24 hours.
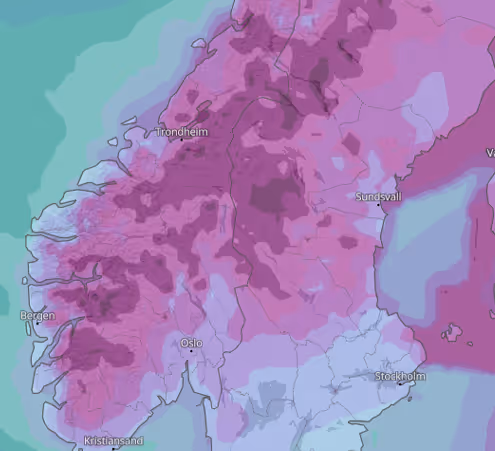
Snow Depth
Snow cover depth on the ground.
Cloud Cover Total
Total cloud coverage across all atmospheric levels expressed as a percentage of sky cover.
Low Clouds (0 – 3.5km)
Cloud cover within the lower atmosphere, often associated with fog, stratus, and low visibility conditions.
Mid Clouds (3.5 – 8 km)
Cloud cover at mid-level altitudes, typically including altostratus and altocumulus formations.
High Clouds (> 8km)
High-altitude cloud cover such as cirrus clouds, often linked to jet stream activity.
Cloud Altitude
Estimated altitude of the cloud base above ground level.
Convective Cloud Height
Vertical distance between the base and top of a cloud formed by warm, rising air convection.
Visibility
Horizontal visibility distance near the surface, relevant for aviation and transport safety.
Wind Convergence (10m)
Areas where surface winds meet and rise, often triggering cloud formation or convection.
Convective Updraft
Strength of rising air currents that drive thermal activity and thunderstorm development.
Soaring Flight Distance
Estimated distance that gliders or birds can travel using thermal lift without engine power.
Soaring Index
Indicator of thermal strength and suitability for gliding and soaring conditions.
Boundary Layer Height
Height of the atmospheric mixing layer influencing turbulence, dispersion, and flight performance.
Clear Air Turbulence (CAT)
Probability of turbulence in cloud-free air, typically near jet streams.
In-Flight Icing
Risk of ice accumulation on aircraft surfaces due to supercooled water droplets at flight altitude.
Wave Period
Time interval between consecutive wave crests, indicating wave energy and motion.
Wave Height
Significant wave height representing the average height of the highest third of waves.
Wave Peak Period
Period of the most energetic waves within the wave spectrum.
Ocean Currents
Surface current speed and direction influencing navigation and drift conditions.
Seawater Salinity
Concentration of dissolved salts in seawater, affecting density and ocean circulation.
Sea Ice Cover
Extent and concentration of sea ice on the ocean surface.
Water Surface Temperature
Temperature of the uppermost ocean layer, relevant for marine ecosystems and weather development.
Air Quality (CAQI)
Composite air quality index (Common Air Quality Index) indicating overall pollution levels and health impact.
Desert Dust
Concentration of airborne mineral dust particles transported from arid regions.
Ozone
Ground-level ozone concentration, a key pollutant affecting respiratory health.
Aerosol Optical Depth
Measure of airborne particles in the atmosphere affecting visibility and solar radiation.
Particulate Matter
Concentration of fine particles (e.g., PM10/PM2.5) suspended in the air.
SO₂
Sulfur dioxide concentration, primarily emitted from industrial processes and combustion.
NO₂
Nitrogen dioxide levels, commonly linked to traffic and urban emissions.
CO
Carbon monoxide concentration resulting from incomplete combustion processes.
Grass Pollen
Concentration of grass pollen in the air, a major seasonal allergen.
Temperature Anomaly (2m)
Projected deviation of near-surface air temperature (2 meters above ground) from the long-term average.
Temperature Anomaly (850 mb)
Forecasted temperature deviation at approximately 1.5 km altitude, reflecting large-scale atmospheric patterns.
Precipitation Anomaly
Expected difference in total precipitation compared to climatological norms.
Snow Depth Anomaly
Projected deviation in snow depth relative to historical averages.
Evapotranspiration Anomaly
Forecasted variation in combined evaporation and plant transpiration compared to normal conditions.
Sea Level Pressure Anomaly
Predicted deviation in atmospheric pressure at sea level, indicating shifts in large-scale circulation.
Wind Speed Anomaly
Expected difference in average wind speed from long-term climatological values.
SST Anomaly (El Niño)
Deviation of sea surface temperature from normal, highlighting patterns such as El Niño or La Niña conditions.
CAPE & Lifted Index
Combined instability indicators showing thunderstorm potential and atmospheric buoyancy.
Lifted Index
Measure of atmospheric stability indicating the likelihood of thunderstorm development.
Storm Helicity (0 – 3 km)
Indicator of low-level rotational wind energy supporting severe storms and tornado formation.
Solar Radiation (GHI)
Global Horizontal Irradiance representing total incoming solar energy at the surface.
UV Index
Standardized scale indicating the intensity of ultraviolet radiation and potential skin risk.
Weather Risk
Aggregated indicator highlighting potentially hazardous weather conditions for outdoor activities.
Success Stories

Syngenta Crop Protection
Syngenta is a leading science-based agtech company, helping millions of farmers around the world to grow safe and nutritious food, while taking care of the planet.
VitiMeteo - Prognostic system for crop protection in viticulture.
An overview of meteorology and its importance in weather forecasting.

WaterApp - When water becomes scarce
A comprehensive overview of the techniques used in weather forecasting.

How to build a network of weather stations in Africa - TAHMO
A detailed analysis of how climate change is altering weather patterns.
Sectors we work with
Energy
Optimise renewable generation and protect critical infrastructure with precise forecasts that prevent equipment failures and maximise output across all your energy assets.
Agriculture
Make smarter farming decisions with weather intelligence that protects crops, optimises field operations, and maximises yields while reducing resource waste.
Transport & Logistics
Keep fleets moving safely and efficiently by predicting road conditions, optimising routes around weather risks, and reducing delays from unexpected weather events.
Urban Resilience
Build cities prepared for tomorrow's climate by designing infrastructure that withstands future conditions and protecting critical systems from extreme weather.
Leisure
Deliver exceptional visitor experiences by planning events with confidence, ensuring guest safety, and optimising operations based on accurate weather forecasts.
Sustainability
Meet climate reporting requirements with regulatory-compliant data that demonstrates environmental progress and aligns business strategy with science-based targets.
Explore our Pricing Options
Flexible pricing plans designed for organizations from startups to enterprises. Explore the solution that fits your needs.
